
Figure 5.
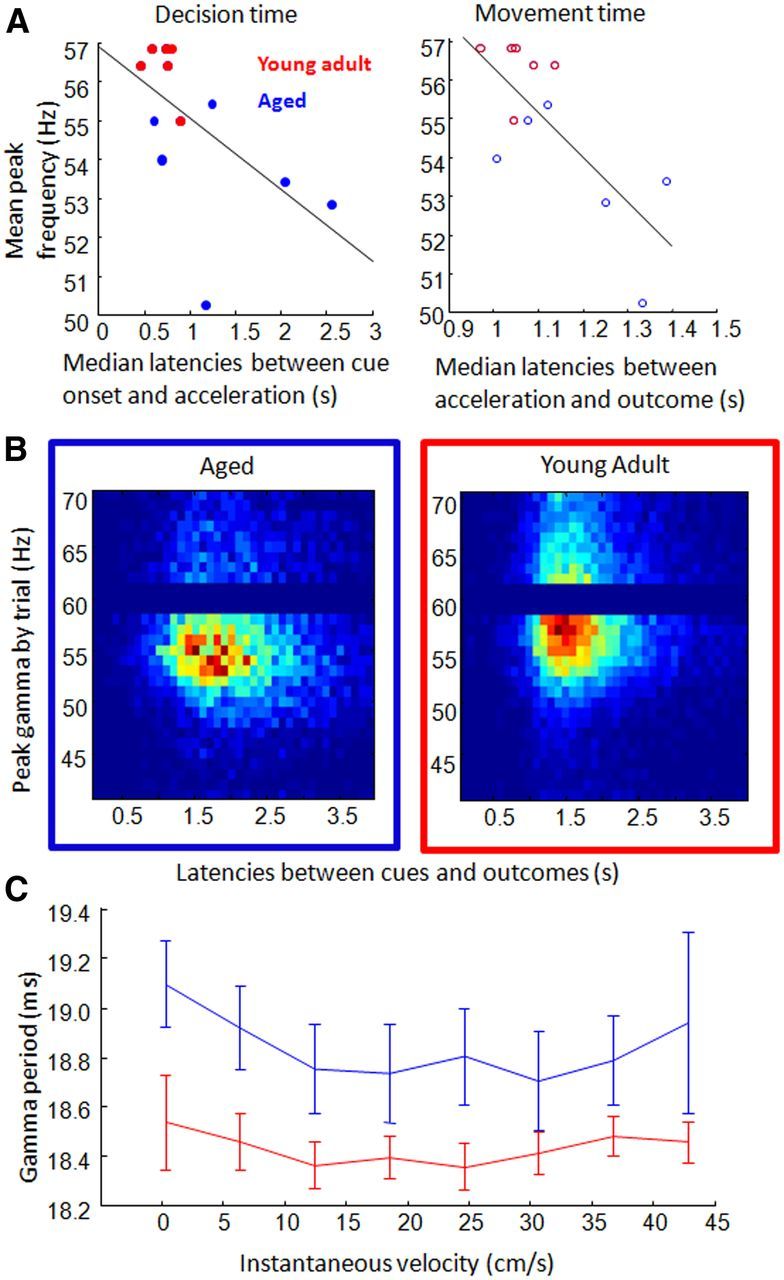
Correlations between behavioral speed and peak gamma. A, Average decision (left) and running (right) latency measures for each rat (x-axis) were significantly correlated with rats' peak gamma frequency (y-axes; blue, aged; red, young adult). B, Three-dimensional histograms for aged (left) and young adult (right) rats show the distribution of peak gamma frequencies across different trial completion times (time between cues and outcomes). Hotter colors represent more trials in which gamma was strongest at that frequency (rows) and in which the trial was completed in a specific amount of time (columns, binned at 0.1 s). Within rats, there was no significant correlation between the peak gamma frequency and completion time of a trial. C, Examination of gamma period length and velocity during brief segments of high-amplitude gamma revealed a persistent age difference across movement speeds (blue, aged; red, young adult).