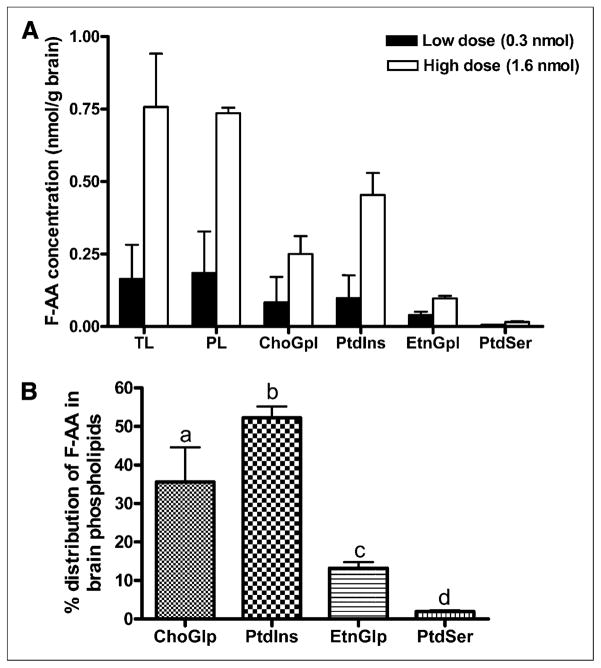
FIGURE 2.
(A) FAA concentration in brain lipids (nmol/g wet weight) after 5-min infusion with low dose (0.3 nmol) or high dose (1.6 nmol). Values are mean ± SD of n = 3 mice for low dose, except for EtnGpl and PtdSer (for which n was 2 because FAA was not detected in 1 mouse), and n = 2 mice for high dose. (B) Percentage distribution of FAA in brain phospholipid subfrac-tions. Bars represent mean ± SD. Bars with overlying letters are significantly different from each other by 1-way ANOVA, followed by Tukey post hoc test. n = 5 for ChoGpl and PtdIns, and n = 4 for EtnGpl and PtdSer because FAA was not detected in 1 mouse infused with low dose. PL = phospholipids; TL = total lipids.

