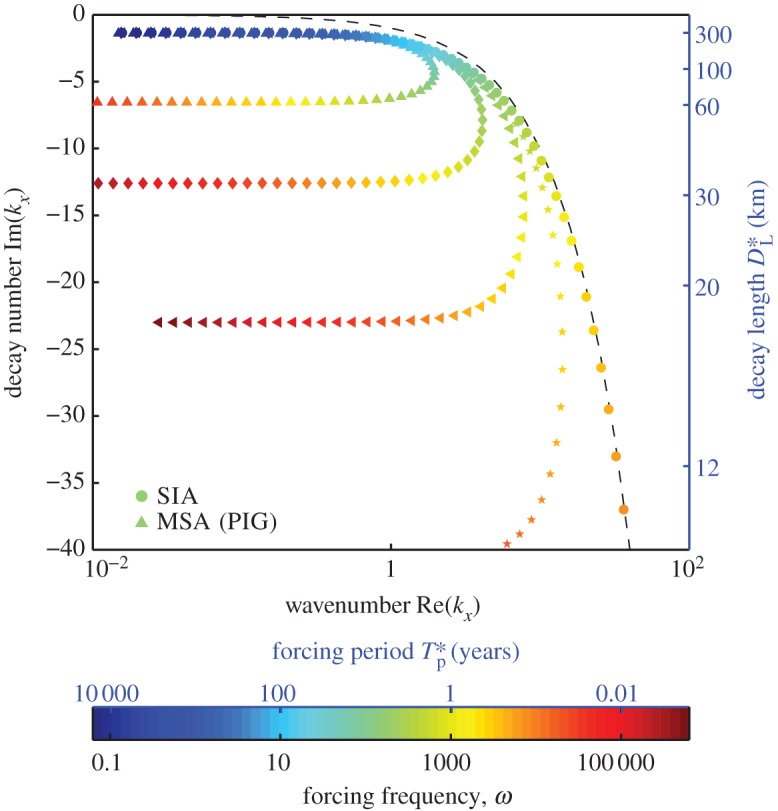
Figure 2.

The relationship between frequency ω and wavenumber kx plotted as dimensionless wavenumber (Re(kx)) and decay number (Im(kx)) as a function of forcing frequency ω for parameters appropriate to Pine Island Glacier (table 1) for the case of basal resistance. A dimensional scale for the decay length D*L is shown (blue right-hand axis, in kilometres) along with a dimensional scale for the forcing period T*p (top blue axis on colour bar, in years). The SIA is shown as solid circles and the MSA is displayed with a range of Ω values, where Ω=0.037 is the standard value for PIG (upward pointing triangles). Ω=0.01, diamonds; Ω=0.003, sideways triangles; Ω=0.001, stars. The line on which Re(kx)=−Im(kx) is also shown (black dashed line).
