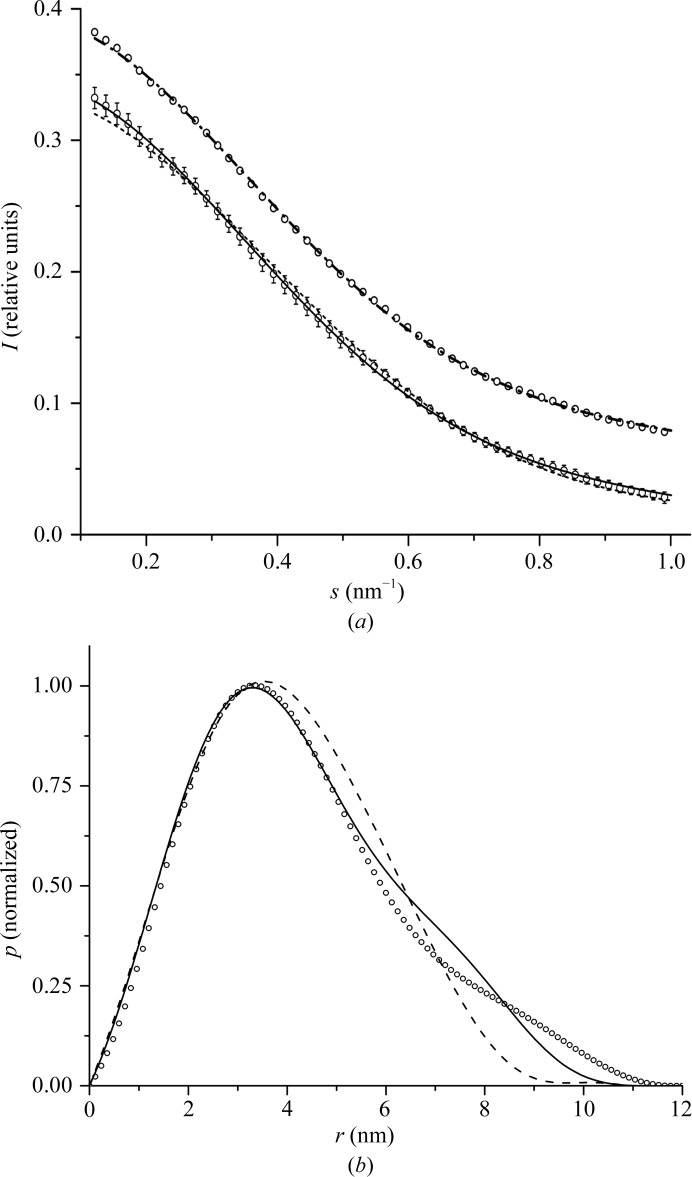
Figure 5.
Results of the SAXS experiment. (a) SAXS intensity profiles for the experimental data (circles) and calculated from models of SsoLig (continuous line) and LigTh1519 (dashed line) and a mixture of the SsoLig (81%) and LigTh1519 (19%) models (dashed/dotted line). The scattering profile for the mixture is shifted vertically by 0.05. The experimental profile is shown twice; one of the copies is also shifted vertically by 0.05 for comparison with the profile for the mixture. (b) Normalized pair-distance distribution functions calculated from experimental SAXS data (circles) and from models of SsoLig (continuous line) and LigTh1519 (dashed line) in the crystalline state.

