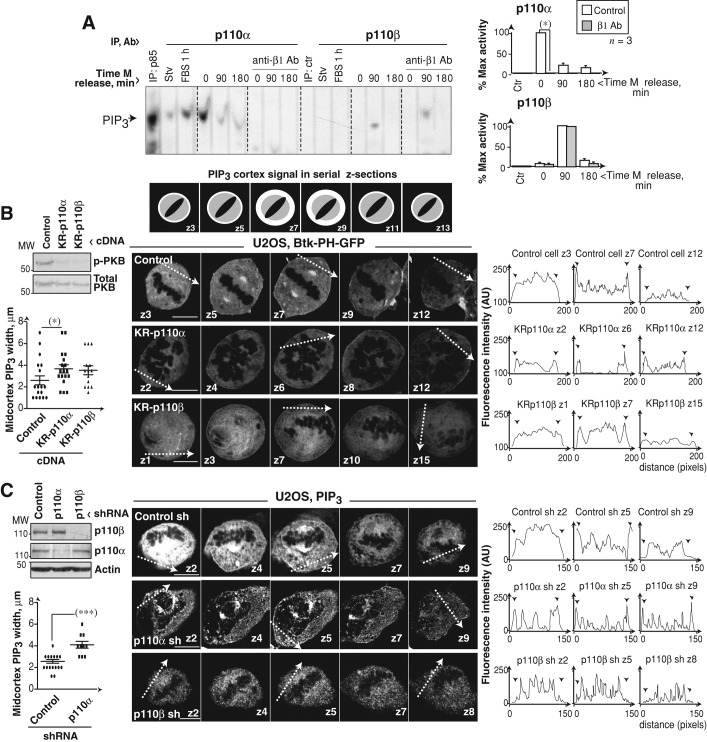
FIGURE 4:
Interference with PI3K reduces midcortex PIP3. (A) U2OS cells were Colcemid-arrested (75 ng/ml, 12 h) and treated with Lia1/2 mAb (100 μg/ml) during and after Colcemid treatment. p110α and p110β were immunopurified and their activity assayed using phosphatidylinositol (4,5)P2 as substrate. Graphs show PIP3 signal intensity relative to maximum p110α or p110β activity (100%, n = 3). (B) Scheme (top) depicts the serial z-sections required to visualize central cortex PIP3 (white). Representative z-sections (0.5 μm) showing PIP3 localization in U2OS cells transfected with GFP-Btk-PH and KR-p110α or KR-p110β (48 h). Graphs (left) show the width (μm) of the midcortical PIP3 (mean ± SD). Western blotting shows p-PKB and PKB levels. Graphs (right) show fluorescence intensity in arbitrary units (AU, pixels) examined along the tracks indicated in the images. Arrowheads indicate cell membrane. (C) IF examination of control, p110α, or p110β knocked-down U2OS cells using specific anti-PIP3 antibody. Analysis was as in (B) z-sections (1 μm). Scale bar: 5 μm. Student's t test: *, p < 0.05; ***, p < 0.001.

