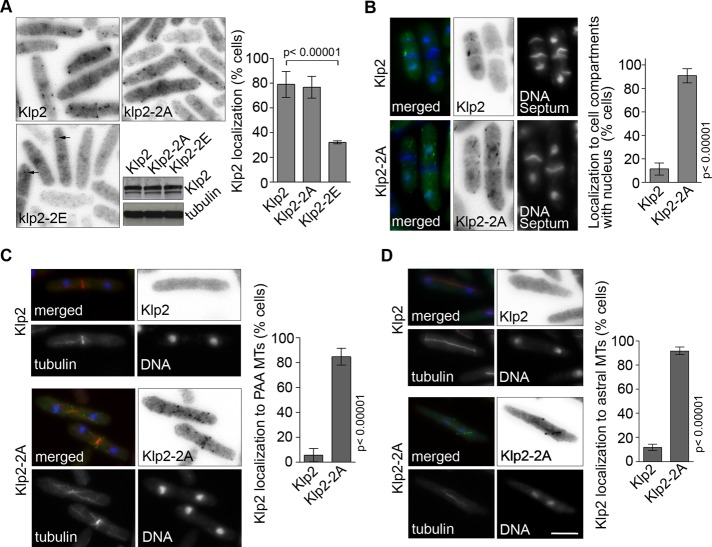
FIGURE 4:
Sid2 phosphorylation of Klp2 regulates its MT localization. (A) Klp2-GFP, Klp2-2A-GFP, and Klp2-2E-GFP were expressed in klp2Δ cells and visualized by microscopy. Klp2 localization was quantified as percentage of cells with fluorescent puncta (previously shown to localize to MTs). Arrows point at faint Klp2-GFP puncta. The relative levels of Klp2-GFP and the Klp2-2A and Klp2-2E are shown. (B) klp2Δ cdc16-116 cells expressing Klp2-GFP or Klp2-2A-GFP were grown at 25°C and shifted to 36°C for 2 h. Cells were scored for the presence of Klp2 or Klp2-2A puncta in cell compartments containing a nucleus (and presumably active SIN signaling). (C) Klp2-GFP and Klp2-2A-GFP were expressed in klp2Δ mCherry-atb2 cells. Cells were grown at 25°C and scored for the presence of Klp2 or Klp2-2A on PAAs of microtubules. (D) Klp2-GFP and Klp2-2A-GFP were expressed in klp2Δ mCherry-atb2 cells at 25°C. Anaphase cells were scored for the presence of Klp2 or Klp2-2A on anaphase MTs. (A–C) Values expressed in bar graphs represent an average and SD of three independent averages obtained from independent experiments. Cells were fixed with cold methanol. Images showing Klp2-GFP are shown inverted for clarity. DNA was stained with DAPI. Bar, 5 μm. All images are at the same magnification.

