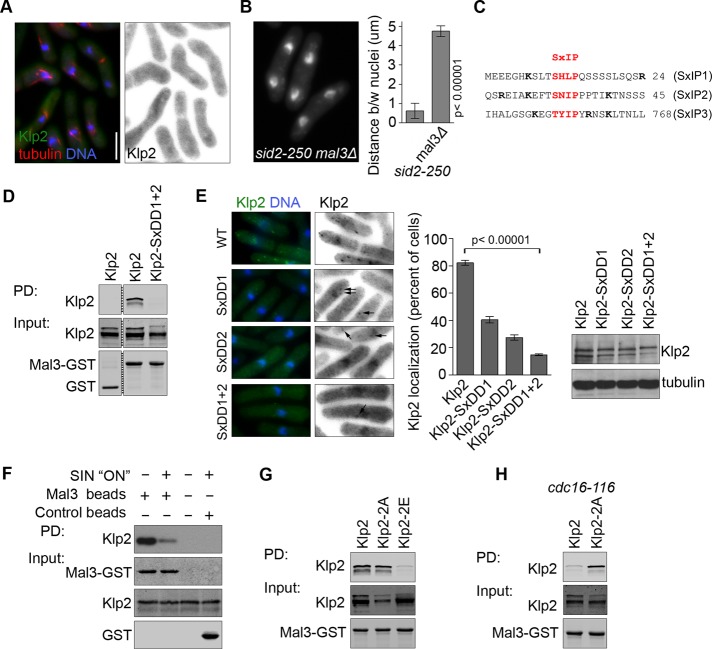
FIGURE 5:
Mal3 loading of Klp2 on MTs is regulated by Sid2. (A) Klp2-GFP was expressed from the endogenous promoter in mal3Δ mCherry-atb2 cells. (B) The distance between nuclei was quantified in sid2-250 and sid2-250 mal3Δ cells after 2 h at 36°C. (C) The protein sequence of Klp2 surrounding consensus EB1/Mal3 motifs (in red). Basic residues flanking the consensus SxIP are shown in bold. (D) Klp2 or Klp2-SxDD1+2 were expressed in klp2Δ cells and pulled down with recombinant purified Mal3-GST. Purified GST protein was used as control. Protein levels were tested by Western blotting. Irrelevant lanes were deleted from the panel (dashed line). (E) Klp2-GFP and the indicated SxIP mutants (also as –GFP fusions) were expressed in klp2Δ cells, and the quantifications reflect the percentage of cells with GFP puncta. Arrows point at faint Klp2-GFP puncta. Protein levels were tested by immunoblotting. (F) Recombinant purified Mal3-GST was used to pull down Klp2-GFP expressed in wild-type or cdc16-116 cells. Cells were grown at 25°C and shifted to 36°C for 2 h. Protein levels were tested by Western blotting. (G) Klp2, Klp2-2A, or Klp2-2E was expressed in klp2Δ cells and pulled down with recombinant purified Mal3-GST. Protein levels were tested by Western blotting. (H) Klp2-GFP or Klp2-2A-GFP was expressed in klp2Δ cdc16-116 cells and pulled down with recombinant purified Mal3-GST. Cells were grown at 25°C and shifted to 36°C for 2 h. In all cases, quantifications represent an average and SD of three independent experiments. Cells were fixed with cold methanol. Images showing Klp2-GFP are shown inverted for clarity. DNA was stained with DAPI. Bar, 5 μm. All images are at the same magnification.

