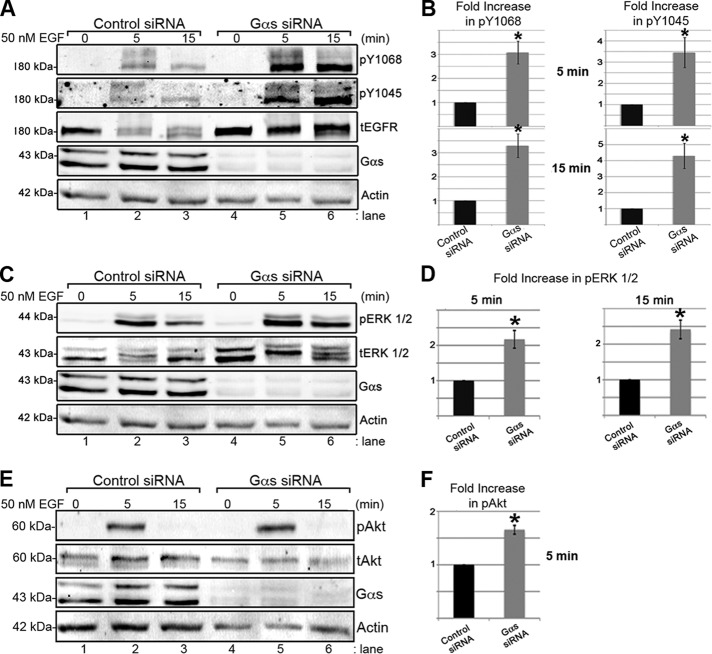
FIGURE 3:
Gαs depletion increases and prolongs EGF-induced EGFR activation and phosphorylation of ERK1/2 but not Akt. (A, B) The amount of activated EGFR (pY1068 and pY1045) seen after EGF stimulation at 5 (lane 5) and 15 (lane 6) min is much greater in Gαs-depleted cells than in controls (lanes 2 and 3). (B) Quantification reveals that pY1068 (n = 3, *p < 0.005) and pY1045 (n = 5, *p < 0.02) are increased greater than threefold in Gαs-depleted cells at 5 and 15 min after EGF stimulation. Cell lysates from control (lanes 1–3) or Gαs-depleted (lanes 4–6) HeLa cells treated as in Figure 2, A–F, were stimulated with 50 nM EGF for 5 or 15 min, immunoblotted for total EGFR (tEGFR), activated EGFR (pY1068- and pY1045), Gαs, and actin, and quantified using Odyssey imaging software, version 2.1. Bands were normalized to actin at each time point, averaged, and plotted as the fold increase in phosphorylation vs. control ± SEM. (C, D) Gαs-depleted cells show greater than twofold more pERK1/2 at 5 (lane 5) and 15 min (lane 6) after stimulation than controls (lanes 2 and 3; n = 4, *p < 0.05). (E and F) Gαs-depleted cells show 1.6-fold more pAkt than controls (lanes 2 and 3) at 5 min (lane 5) but not at 15 min (lane 6) after stimulation (n = 4, *p < 0.001). Control (lanes 1–3) or Gαs-depleted (lanes 4–6) HeLa cells treated as in A were immunoblotted for pERK1/2, tERK1/2, pAkt, tAkt, Gαs, and actin and quantified as in B.

