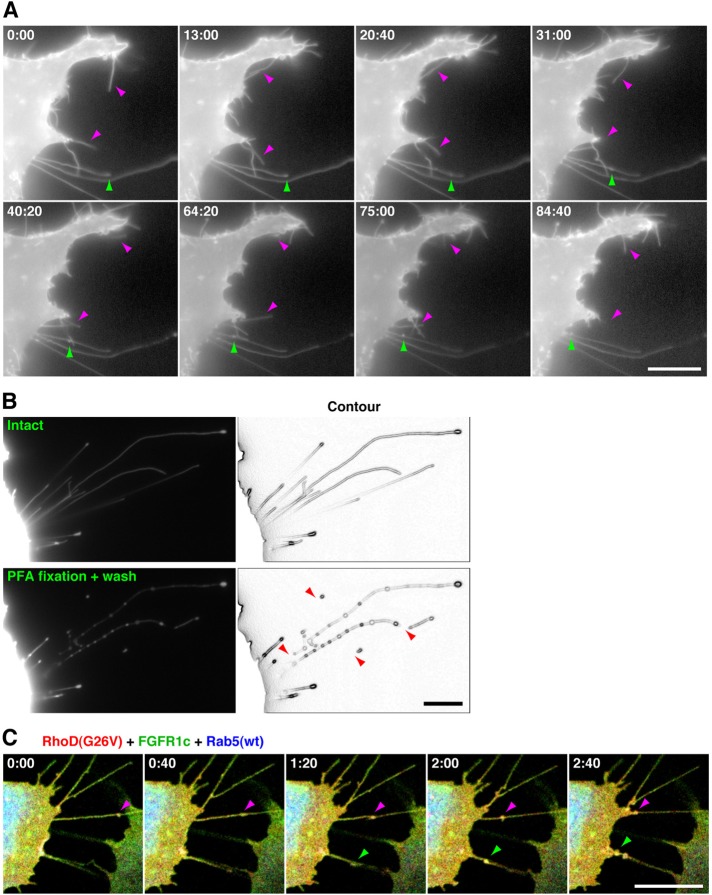
FIGURE 2:
RhoD generates two types of thin protrusions detected in unfixed cells. (A) Time-lapse images of two types of RhoD-induced protrusions. The 10T1/2 cells transfected with EGFP–RhoD(G26V) were analyzed by time-lapse imaging at the time indicated (min:s). Magenta arrowheads indicate shorter protrusions moving flexibly and dynamically. Green arrowheads point to a nodule moving in a retrograde direction through a longer immotile protrusion. (B) Breakdown of RhoD-induced protrusions by PFA fixation and washing. The 10T1/2 cells transfected with EGFP–RhoD(G26V) were observed before (top) and after (bottom) 15-min PFA fixation and washing with PBS. Arrowheads indicate collapsed or fragmented longer protrusions. (C) Time-lapse images of FGFR1c- and Rab5-containing nodules moving through the RhoD(G26V)-induced protrusions. The 10T1/2 cells cotransfected with mOrange2–RhoD(G26V) (red), FGFR1c–EGFP (green), and Cerulean–Rab5(wt) (blue) were analyzed by time-lapse imaging at the time indicated. Arrowheads point to FGFR1c- and Rab5-containing nodules moving through protrusions. Scale bars: 10 μm.

