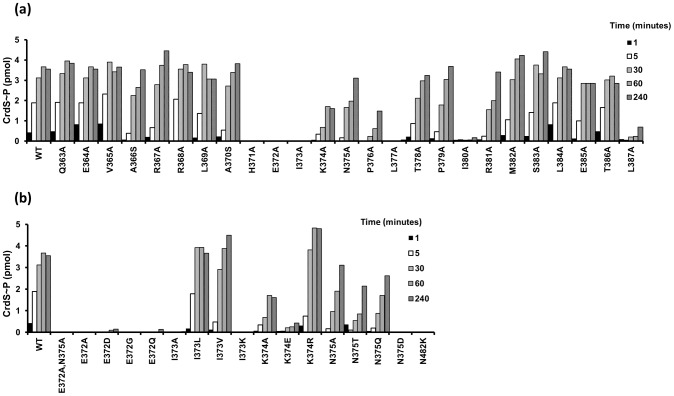
Figure 3. Kinase Activity of CrdS α1 Mutants.
Purified WT and mutant proteins were diluted to 5 µM and allowed to autophosphorylate for 1, 5, 30, 60 and 240 minutes before the reactions were terminated and quantified (pmol of phosphorylated CrdS proteins shown on the y-axis). Amino acid substitutions were generated by site-directed mutagenesis and are indicated along the x-axis with numbers corresponding to the amino acid position of CrdS. Data shown is that of a representative set. (A) Autophosphorylation levels are shown for each alanine (or serine) substitution mutant protein relative to CrdS-WT shown at left. (B) Autophosphorylation of additional substitution mutants generated within the highly conserved region of CrdS. WT CrdS is shown at left.

