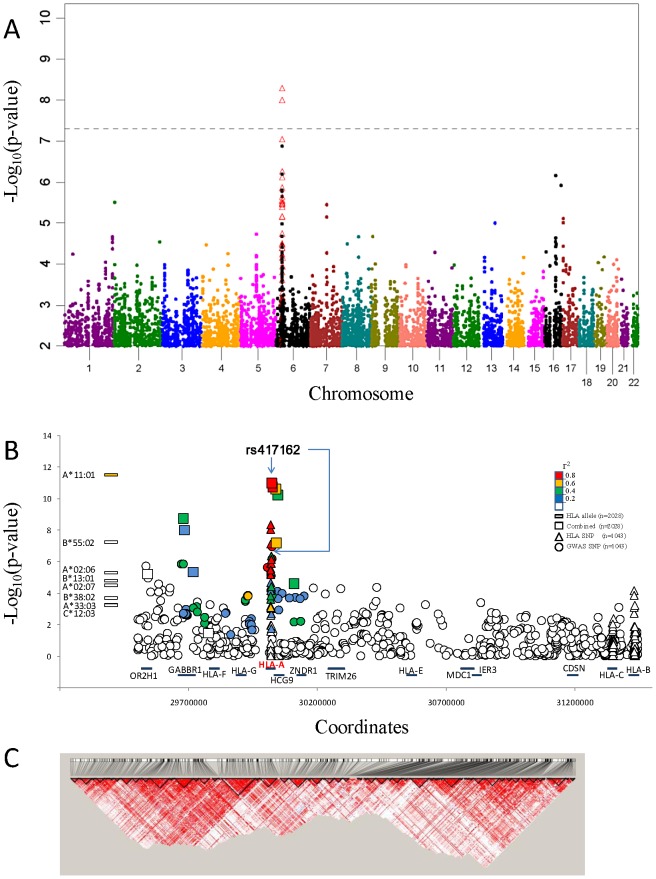
Figure 1. NPC associations of GWAS and Taqman validation.
A.) Manhattan plot of GWAS P value association results of 591,458 SNP allele genotypes versus chromosome coordinate position (N = 1043 study participants; Row I in Table S3). Association p-values (-log10 transformed) are calculated by logistic regression in additive logistic model and plotted by genomic position. Association p-values for HLA SNP that were assessed by HLA sequence base typing for the same 1043 individuals are indicated by open red triangles (see text). B.) NPC association signal for significant HLA alleles (left) and included SNP variants on Chromosome 6.The –log10 p values, calculated with the logistic regression model, in GWAS and combined association tests are shown, SNPs are ordered according to the location on chromosome 6 HLA-A region. Color coded indicate the LD value (r2) of each variant with the most significant SNP rs417162. C.) Disequilibrium coefficient values for SNPs genotyped in the HLA region for NPC GWAS (N = 1043), generated with the use of Haploview software.

