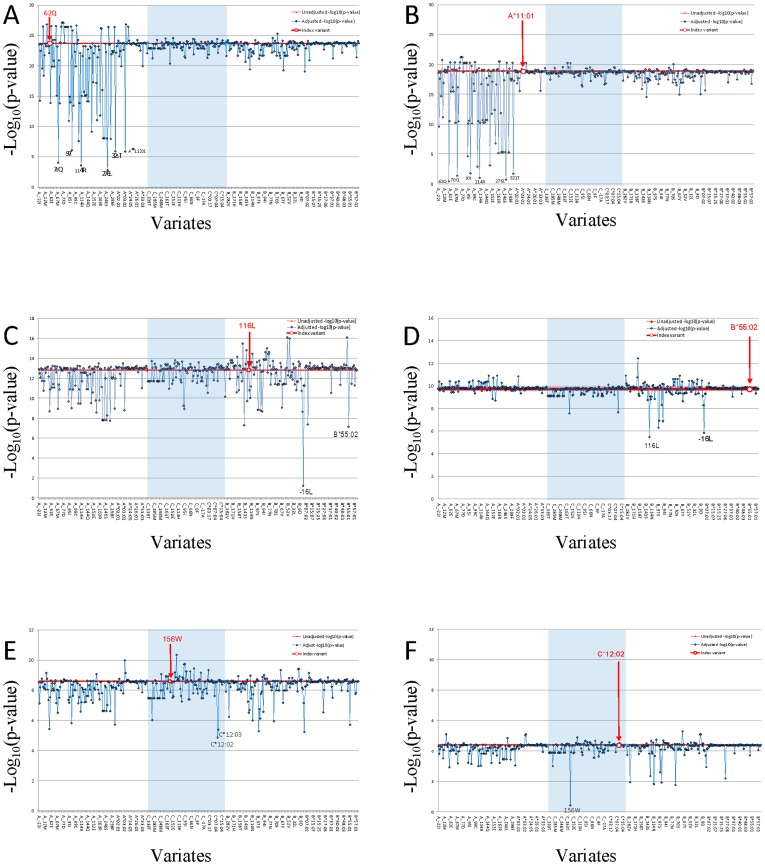
Figure 3. Proxy variant analysis for the strongest aa-variants or HLA allele in HLA-A, in HLA-B, and in HLA-C.
Genetic association of each HLA amino acid variant was calculated. Study participants in both phase I and phase II (N = 4055 study participants; Line V in Table S3). Multivariate conditional logistic regression analysis was performed to compute amino acid variants (A, C, and E) or HLA alleles (B, D, and F) association p-value. The HLA typing data set (N = 4055 study participants; Line V in Table S3) were used PLINK to examine the residual effect of index amino acid variant or HLA allele while using other amino acid variant or HLA allele as a covariate, and we adjusted the results for age and gender. The index amino acid variant or HLA allele was marked with bold red font. The red line indicated unadjusted –log10 p of index. Three HLA class I genes regions were separated by light blue block of HLA-C gene between HLA-A and HLA-B. The X-axis is amino acid or HLA allele covariate, ranking by their coordinate. HLA alleles were group together ranking by allele names in each HLA class I gene locus. The Y-axis is the –log10p of index variant adjust by covariate. Independent variants should not change the adjusted p-values from the strong unadjusted values of the index variant, while LD-proxies would reduce their p-values appreciably depending upon the strength of LD.

