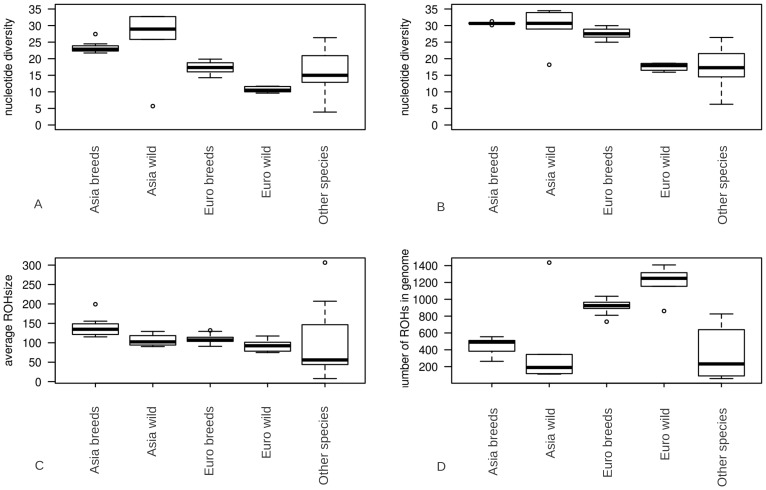
Figure 1. Summary statistics for genomic variation.
The distributions of ROH statistics for Asian breeds (n = 7), Asian wild boars(n = 5), European breeds (n = 29), European wild boars (n = 6) and other species (n = 5). Groups are divided based on geography (Asians and Europeans), domestication (pigs and wild boars) and speciation (Other-species include the African Warthog Phacochoerus africanus and other representatives of the Sus genus being Sus barbatus, Sus celebensis, Sus verrucosus and Sus cebifrons). Values are averaged within individuals resulting in a single data point per ROH characteristic for each individual. 1A. nucleotide diversity including ROHs (*10−4 bp) 1B. nucleotide diversity excluding ROHs (*10−4 bp) 1C. Average ROH size (*104 bp) 1D. number of ROHs in the genomes of individuals.

