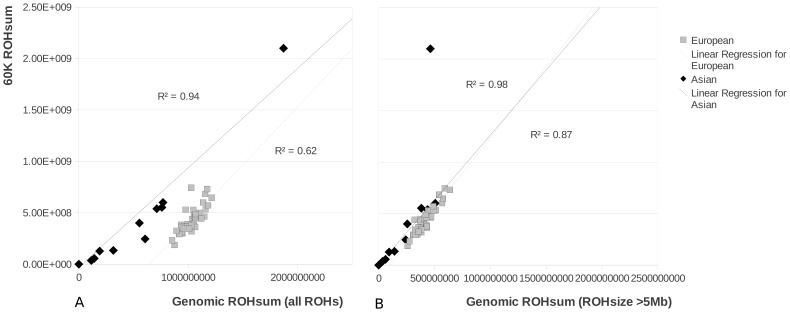
Figure 3. ROH size in pigs based on the 60K chip method and the re-sequencing method.
3A shows the correlation between both methods when the total sum of ROHs is taken from the re-sequencing method (‘Genomic ROHsum’) and the 60K chip method (‘60K ROHsum’). In 3B the correlation is shown when only the ROHs over 5 Mbp are taken into account for the re-sequencing method. The outlier for the Asian group (the Japanese wild boar) is not included in the R2 calculations.

