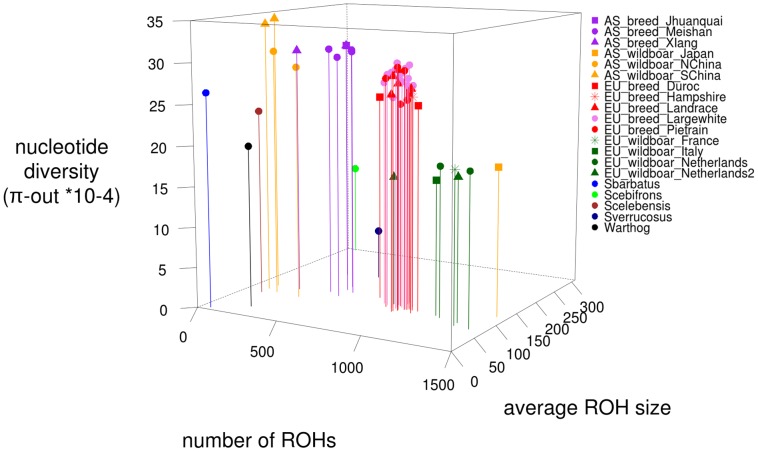
Figure 5. Three-point ROH statistics for all 52 sequenced individuals.
On the x-axis, the number of ROHs in the genome per individual is plotted, the average ROH size (*104 bp) is displayed on the y-axis and the nucleotide diversity outside ROHs in a 10 kb window ‘nucleotide diversity (π-out *10−4)’ on the z-axis. Coloration is based on relatedness and geography, with individuals from the same populations having the same color.

