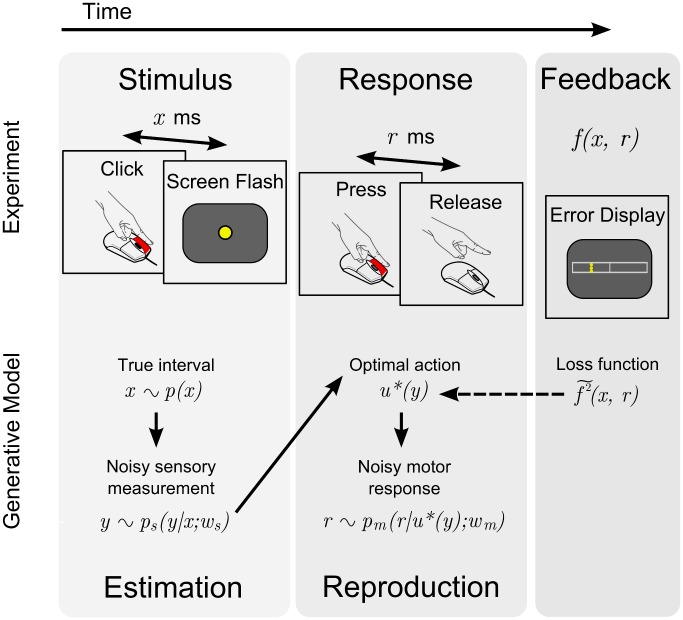
Figure 2. Time interval reproduction task and generative model.
Top: Outline of a trial. Participants clicked on a mouse button and a yellow dot was flashed  ms later at the center of the screen, with
  drawn from a block-dependent distribution (estimation phase). The subject then pressed the mouse button for a matching duration of
  ms (reproduction phase). Performance feedback was then displayed according to an error map
  . Bottom: Generative model for the time interval reproduction task. The interval
  is drawn from the probability distribution
  (the objective distribution). The stimulus induces in the observer the noisy sensory measurement
  with conditional probability density
  (the sensory likelihood), with
  a sensory variability parameter. The action
  subsequently taken by the ideal observer is assumed to be the ‘optimal’ action
  that minimizes the subjectively expected loss (Eq. 1);
  is therefore a deterministic function of
  ,
,  . The subjectively expected loss depends on terms such as the prior
  and the loss function (squared subjective error map
  ), which do not necessarily match their objective counterparts. The chosen action is then corrupted by motor noise, producing the observed response
  with conditional probability density
  (the motor likelihood), where
  is a motor variability parameter.

