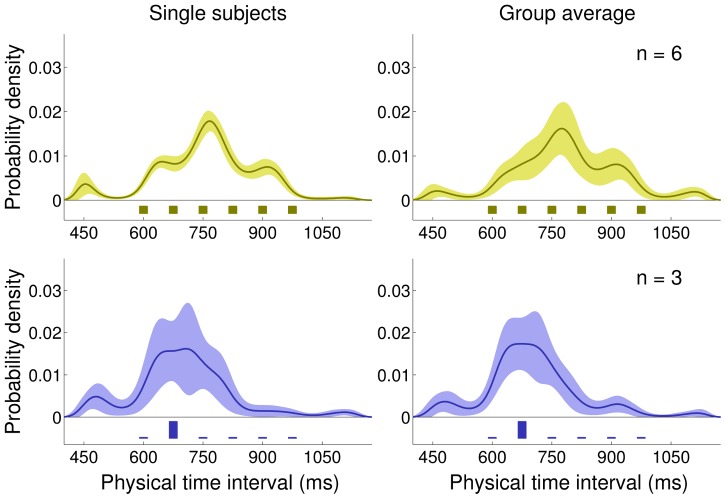
Figure 8. Nonparametrically inferred priors (Experiment 3 and 4).
Top row: Medium Uniform (light brown) block. Bottom row: Medium High-Peaked (dark blue) block. Left column: Nonparametrically inferred priors for representative participants. Right column: Average inferred priors. Shaded regions are  s.d. For comparison, the discrete experimental distributions are plotted under the inferred priors.

