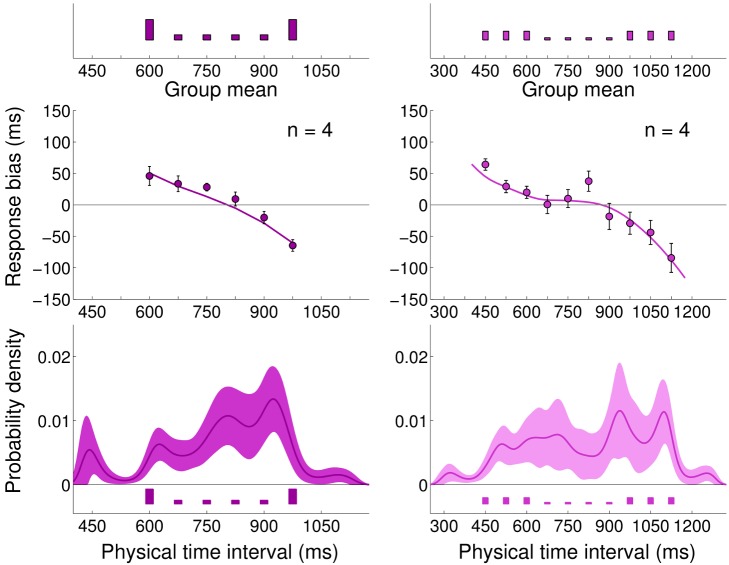
Figure 9. Experiment 5: Medium Bimodal and Wide Bimodal blocks, mean bias and nonparametrically inferred priors.
Very top: Experimental distributions for Medium Bimodal (dark purple, left) and Wide Bimodal (light purple, right) blocks. Top: Mean response bias across subjects (mean  s.e.m. across subjects) for the Medium Bimodal (left) and Wide Bimodal (right) blocks. Continuous lines represent the Bayesian model ‘fit’ obtained averaging the predictions of the most supported models across subjects. Bottom: Average inferred priors for the Medium Bimodal (left) and Wide Bimodal (right) blocks. Shaded regions are
  s.d. For comparison, the experimental distributions are plotted again under the inferred priors.

