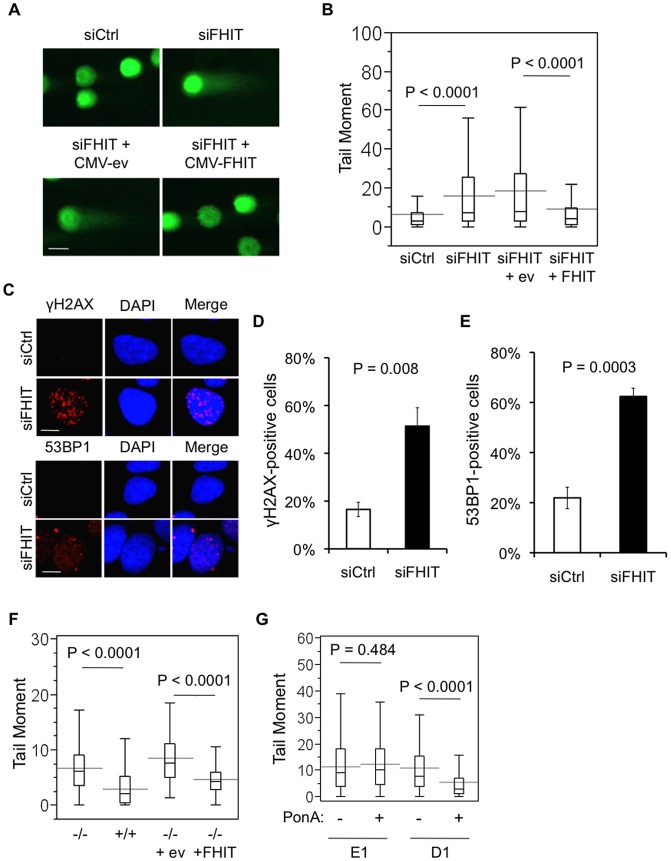
Figure 1. Fhit-deficient cells exhibit spontaneous DNA breaks.
(A) Neutral comet assays of HEK293 cells 2 days after transfections with siRNAs and pRcCMV-FHIT-flag or pRcCMV-empty-flag plasmids. Representative nuclei are shown; bars, 20 µm. (B) Box plots of Tail moments include data (siCtrl, n = 183; siFHIT, n = 142; siFHIT+CMV-ev, n = 135; siFHIT+CMV-Fhit, n = 132) from 3 separate experiments. Statistical significance was determined using the Kruskal-Wallis rank sum test. (C) Indirect immunofluorescence of γH2AX and 53BP1, 2 days after Fhit knockdown. Representative nuclei are shown; bars, 10 µm. (D and E) Quantification of γH2AX-positive cells (D) and 53BP1-positive cells (E). Bar graphs indicate the means, and error bars represent the standard deviations. Data were collected from 3 independent experiments. Statistical significance was assessed using a 2-sided Student's T-test. (F) Neutral comet assays of Fhit +/+ or Fhit −/− mouse kidney cells 48 h after transfection with pRcCMV-FHIT-flag or pRcCMV-empty-flag plasmids. Box plots of Tail moments are shown. Statistical significance was determined using the Mann-Whitney rank sum test. (G) Neutral comet assays of Fhit-deficient H1299 lung carcinomas cells, with or without induction of Fhit expression. Comet assays were performed 48 h after ponasterone A-induction of Fhit expression. Box plots of Tail moments are shown. Statistical significance was determined using the Mann-Whitney rank sum test.

