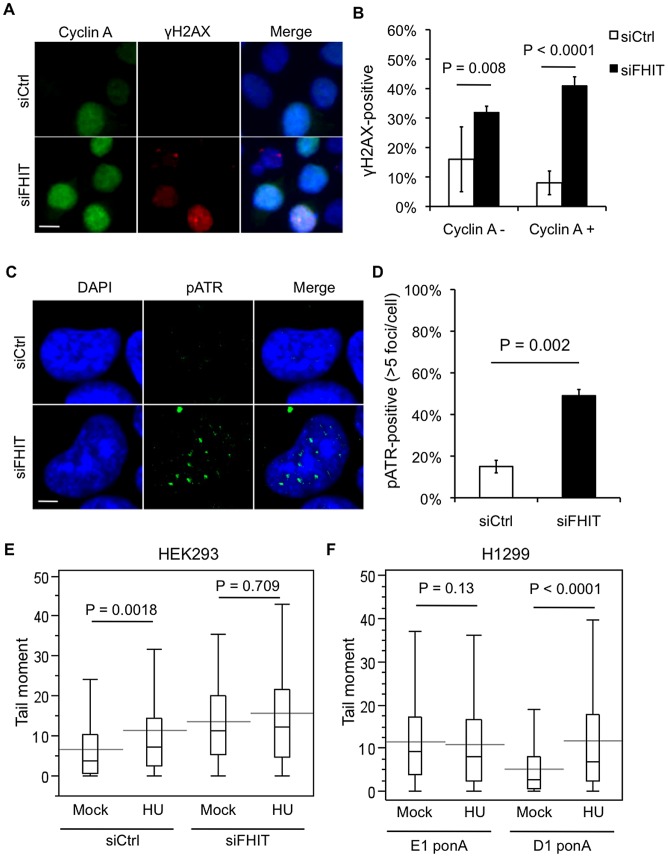
Figure 2. Loss of Fhit causes replication stress.
(A) Cyclin A and γH2AX indirect immunofluorescence after Fhit knockdown. Representative images are shown; bars, 10 µm. (B) Data obtained in (A) were quantified from 3 independent experiments, and statistical significance was determined using a 2-sided T-test. Bar graphs represent the means, and error bars mark the standard deviations. (C) pATR immunofluorescence 2 days after Fhit knockdown in HEK293 cells. Representative images are shown; bars, 5 µm. (D) Quantification of cells positive for more than 5 pATR foci/cell from 3 independent experiments; statistical significance was determined using a 2-sided T-test. (E) Neutral comet assays in siRNA transfected HEK293 cells treated with 2 mM hydroxyurea for 4 h. Box plots show quantification of Tail moments. P-values were determined using the Mann-Whitney rank sum test. (F) Neutral comet assays in H1299 E1 and D1 cells with ponasterone A-induction treated with 2 mM hydroxyurea for 4 h. Box plots show quantification of Tail moments. P-values were determined using the Mann-Whitney rank sum test.

