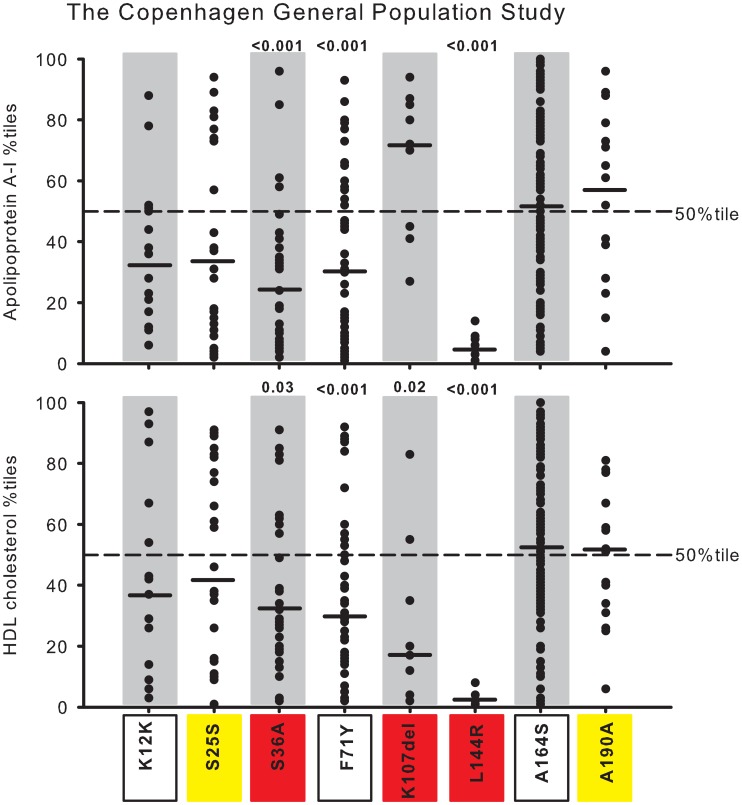
Figure 5. Plasma apoA-I and HDL cholesterol in percentiles for nonsynonymous and synonymous variants in APOA1.
Data are from the Copenhagen General Population Study (CGPS). Each dot represents an individual with a given genetic variant. Percentiles are corrected for gender and age. P-values according to z-test comparing mean apoA-I or HDL cholesterol percentiles in heterozygotes with individuals in the CGPS as a whole. Solid black lines = median percentiles. Dashed line = 50th percentile. Red, nonsynonymous variants identified exclusively in the lowest 20 percentile of the apoA-I distribution in the CCHS using the extreme phenotype approach; yellow, synonymous variants identified exclusively in the lowest 20 percentile; white boxes, nonsynonymous and synonymous variants identified in both the lowest and highest 20 percentiles.

