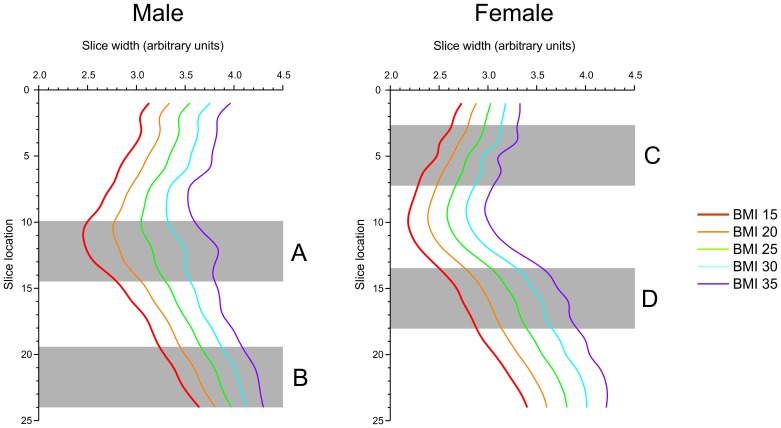
Figure 4. Plots of the width of the right side of the torso, starting from the midline, for the average male and female bodies at five different BMI levels.
The plots illustrate that increasing BMI is associated not only with a generalized increase in torso width, reflected by the systematic separation of one profile from the next, but also with a non-linear component to the change in body shape. This non-linear component is illustrated by the male torso outline in sub-regions A (near the waist) and B (the lower hip). In region A, as BMI increases from 15 to 35, the contour of the waist changes from convex to concave and in region B, the slope of the line from lower to higher hip slices becomes less and less steep. There are similar non-linear shape changes in the female torso in sub-regions C (the upper chest) and D (upper hip).

