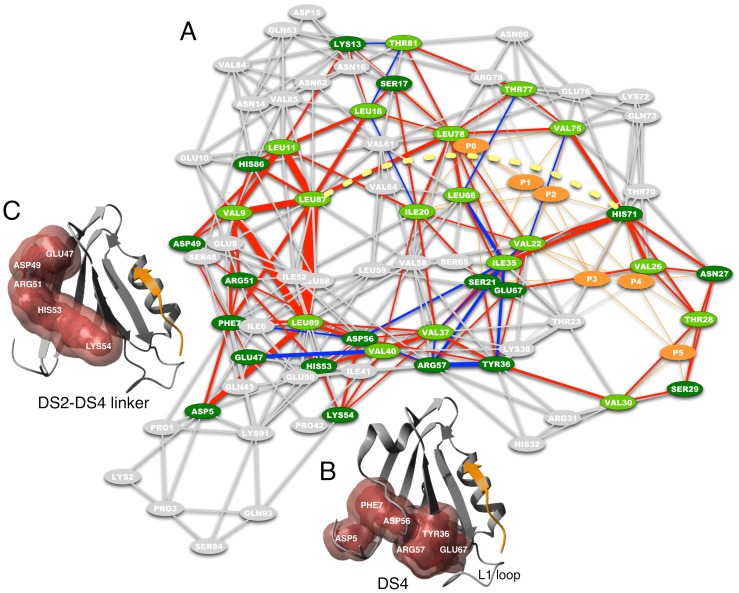
Figure 2. Network of short-range dynamical changes in hPDZ2.
A) Residues highlighted in green are predicted on the basis of the complete matrix of changes in MI (light green for the methyl-group bearing side-chains and dark green for the others). Red edges represent an increase in MI, while blue edges represent a decrease in MI. The thickness of the edges represents the magnitude of change. Peptide residues and their contacts with the domain residues are highlighted in orange and the links connecting the peptide residues with the structure are not weighted. Yellow-dotted line illustrates an example of a long-range dynamical effect between LEU87 and HIS71. The network visualization follows the organic layout as implemented in Cytoscape [44]. B) The non-methyl bearing residues composing the continuous surface DS4, are highlighted in red on the ribbon structure of hPDZ2. C) The non-methyl bearing residues composing the continuous surface that links the two distal surfaces DS2 and DS4, are highlighted in red on the ribbon structure of hPDZ2.

