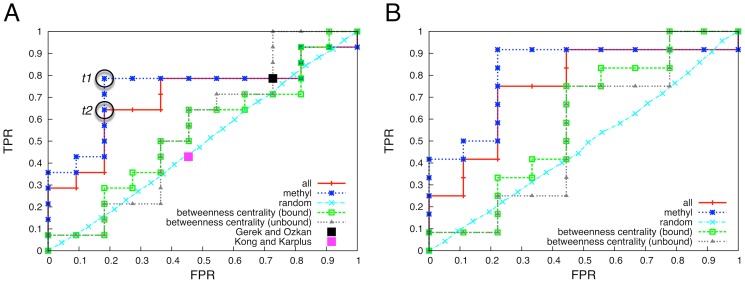
Figure 3. Quality assessment of the different predictors.
A) ROC curves of the information theoretical approach considering either the dynamical changes in the methyl side-chain containing residues only (blue line) or dynamical changes for all the residue types (red line); the black square represents the performance of the Gerek and Ozkan predictor [21], the purple square represents the Kong and Karplus [20] predictor performance; grey and green lines represent the performance of a predictor ranking residues according to their betweenness centrality in the network derived from physical contacts using, respectively, the apo and the bound crystal structures. The two encircled points t1 and t2 correspond to the best performing predictors. B) The same as A, yet without the alanine residues, which were needed in the previous case for a fair comparison with the other approaches. We plot again the ROC curves of our approach compared to the baseline predictors in this setting.

