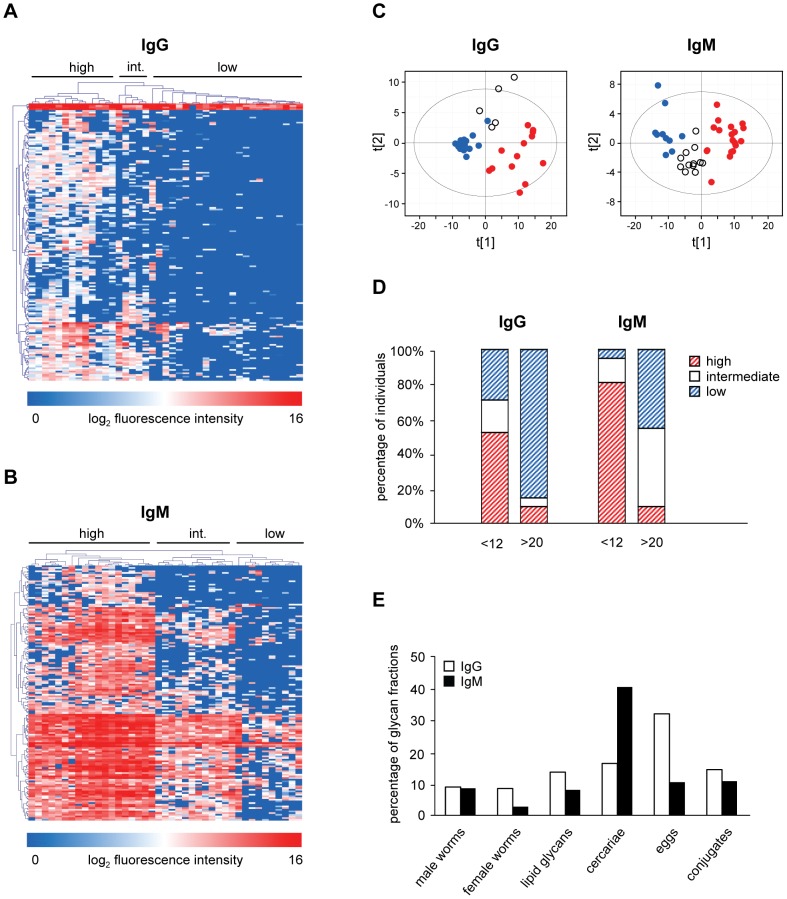
Figure 3. Age groups.
Comparisons of anti-glycan responses between age group <12 years and >20 years. Supervised HCA and PCA of differentially expressed glycan fractions are shown for IgG (A+C) and IgM (B+C), percentage of individuals per age group clustering together in the supervised HCA (D) and percentage of differentially recognized glycan fractions (E). For HCA, individuals are reported in horizontal dimension and differentially recognized glycan fractions in the vertical dimension. In (C) and (D), individuals clustering in high, intermediate (int.), and low response clusters are represented by red, white, and blue dots and (dashed) bars, respectively. In (E), the number of differentially recognized glycan fractions is depicted as a percentage of the total number of glycan fractions from each source. White and black bars represent results for IgG and IgM respectively.

