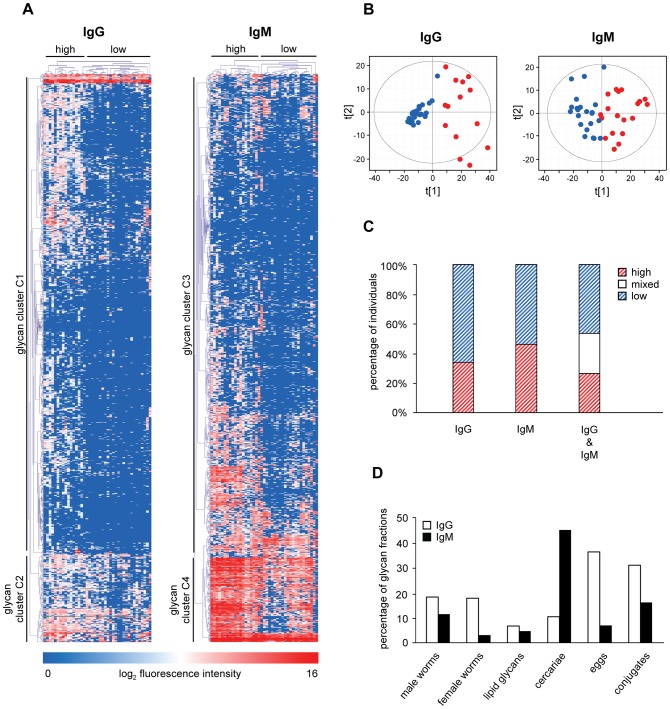
Figure 4. Unsupervised clustering analyses.
Hierarchical clustering analysis (A) and PCA (B), percentage of individuals clustering together in the HCA (C) and percentage of glycan fractions in clusters C2 and C4 (D). For HCA, individuals are reported in horizontal dimension and glycan fractions in the vertical dimension. In the PCA, high and low response clusters are represented by red and blue dots, respectively. Percentages of individuals per response cluster in the unsupervised HCA are shown in C. Red and blue bars represent percentage of individuals clustering in high and low response clusters, respectively. White bars represent individuals with low IgG+high IgM and high IgG+low IgM response (mixed). In (D) the number of glycan fractions present in glycan clusters C2 and C4 is depicted as a percentage of the total number of glycan fractions from each source. White and black bars represent results for IgG and IgM, respectively.

