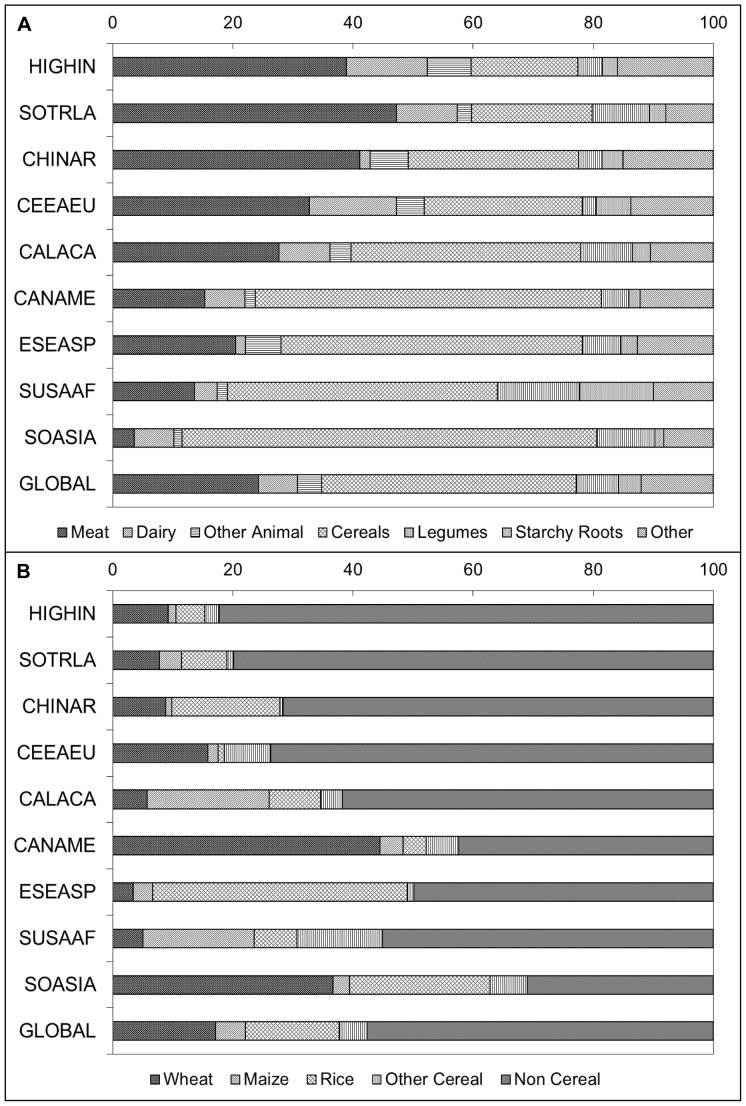
Figure 2. Percentage of total zinc in national food supplies derived from (a) all food sources and (b) cereal and non-cereal sources.
Regional data are weighted by national population size and listed in ascending order according to the estimated prevalence of inadequate zinc intake in the region. HIGHIN, High-income; SOTRLA, Southern and Tropical Latin America; CHINAR, China; CEEAEU, Central and Eastern Europe; CALACA, Central and Andean Latin America and the Caribbean; CANAME, Central Asia, North Africa and the Middle East; ESEASP, East and South-East Asia and the Pacific; SUSAAF, Sub-Saharan Africa; SOASIA, South Asia. Data are for the 2005 time frame (2003–2007).

