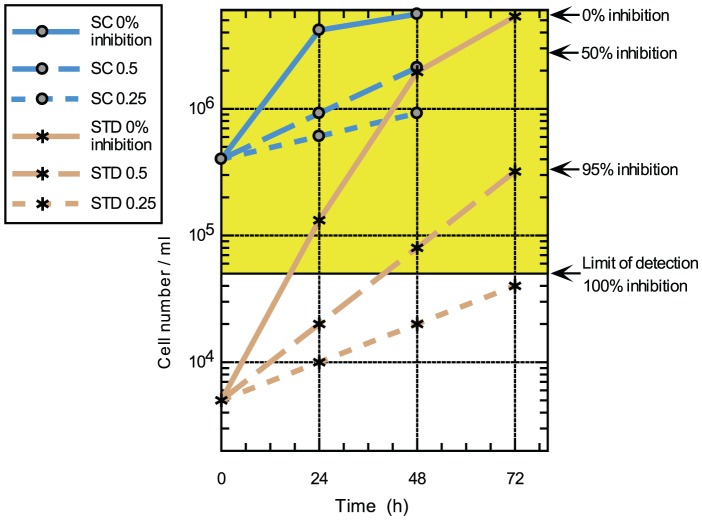
Figure 5. Model to explain the effect of starting-density on the dose-response profile.
Measured (solid lines, 0% inhibition, growth rate = 1) and predicted (dashed lines) growth curves for T. brucei in the standard (STD) and static-cidal (SC) assays. Predicted growth curves are for 50% inhibition of growth rate (long dashes, growth rate = 0.5) and 75% inhibition of growth rate (short dashes, growth rate = 0.25). Percent inhibition as calculated at t = 72 h (STD) or t = 48 h (SC) is given on right hand side. The yellow shaded area represents cell densities above the detection limit.

