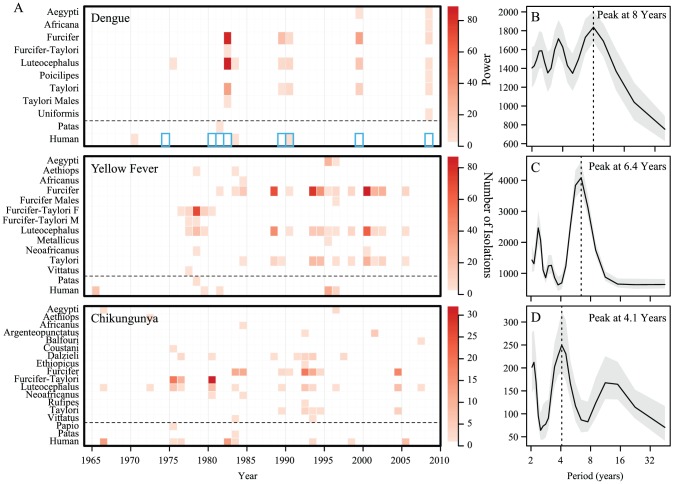
Figure 1. Summary of dengue, yellow fever and chikungunya isolates, 1962–2008.
Panel A shows number of dengue, yellow fever and chikungunya virus isolates over time by species. Scales at right indicate number of isolations. Blue boxes on dengue heatmap indicate sylvatic human isolations reported in Diallo et al. (2003). Dashed black lines separate mosquito isolations from primate isolations. Panels B, C and D show the Fourier power spectrum with Daniell smoothers of (3,3) with 95% bootstrap confidence intervals for the aggregated dengue, yellow fever and chikungunya virus isolates, respectively. A detailed description of surveillance methods has been published previously [2].

