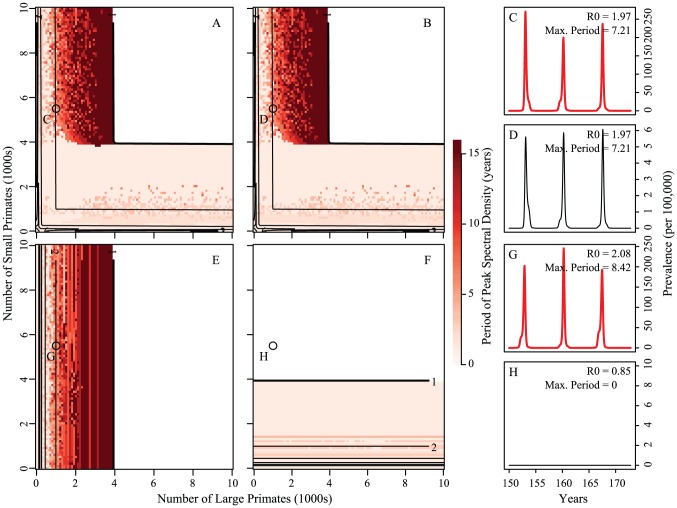
Figure 4. Prevalence in large and small primates in the coupled and uncoupled systems without constant introduction.
Panels A and B show results for models with coupling, E and F for uncoupled models. Panel A and E characterize the dynamics of dengue in the large primate species, B and F dengue dynamics in the small primate species. Coupled models (A, B, C and D) are coupled at 1/500th of the on-diagonal biting rates. Panels C, D, G and H show time series for large (C, G) and small primates (D, H) with parameters indicated by the circles in panels A, B, E and F ( and
and  ). The only parameter difference between panels A–D and panels E–H are the off-diagonal biting rates. Contour lines are analytically calculated values of
  (see Supporting Information S1). The dynamics in the mosquito population are qualitatively identical and can be found in Figure S5. Other parameters are:
  ,
,  ,
,  ,
,  ,
,  , and
, and  ,
,  .
.

