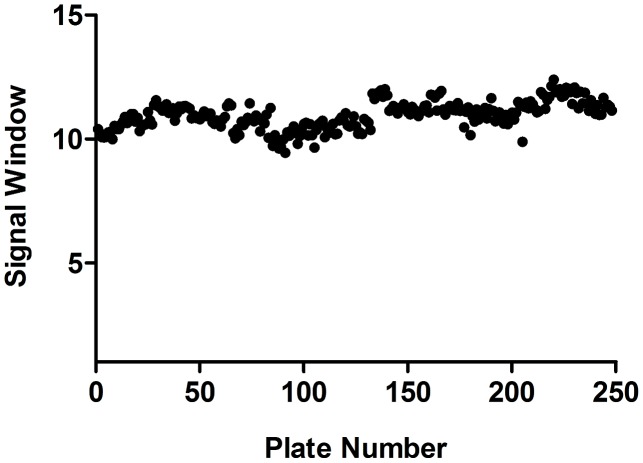
Figure 2. Signal window in the T.b. brucei primary screening campaign.
The signal window for each of 248 plates containing test compounds in the primary screening campaign, expressed as a ratio of the negative to positive controls. Each dot represents the signal window calculated for a single plate. Control plates, one per 20 test compound plates, contained half a 384-well plate of 2 µM of the positive control compound, pentamidine. Negative assay controls, of 0.42% DMSO, were contained in column 24 of each assay plate containing test compounds, or 16 wells in total. The signal window was based on the average of column 24, divided by the average of the positive control taken from the control plate.

