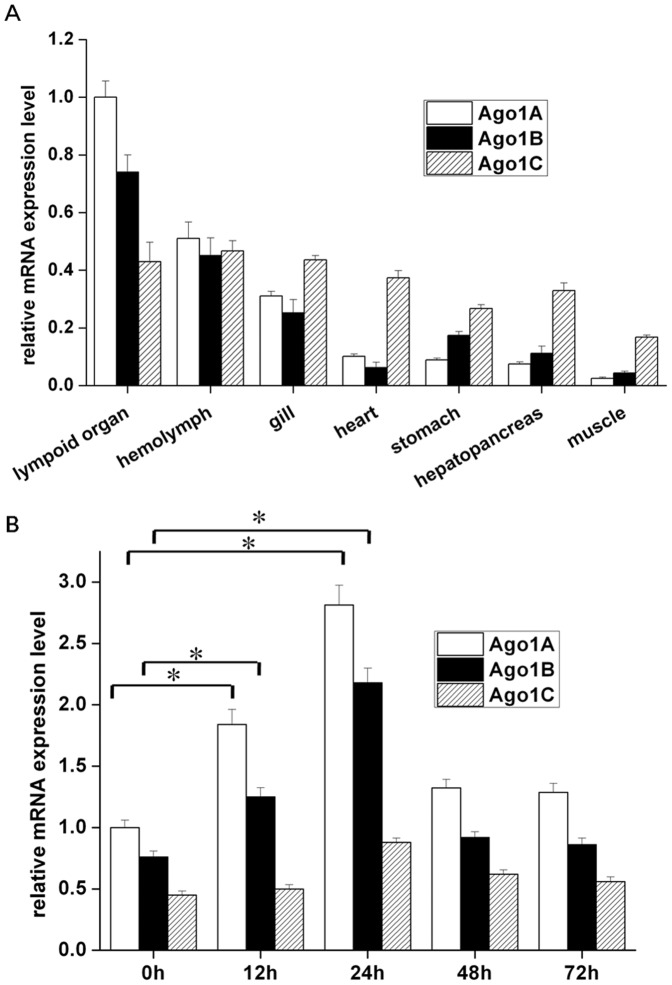
Figure 4. Expression profiles of Ago1 isoforms in shrimp.
(A) Expression patterns of Ago1 isoforms in different tissues or organs of shrimp as revealed by quantitative real-time PCR. The shrimp β-actin was used as an internal standard. The relative expression levels of Ago1A, Ago1B, and Ago1C mRNAs were compared with that of Ago1A in lymphoid organ. Each column represented the mean of triplicate assays within 1% standard deviation. (B) The time-course of expression profiles of Ago1 isoforms in lymphoid organ of shrimp challenged with WSSV by quantitative real-time PCR. The relative expression levels of Ago1A, Ago1B, and Ago1C mRNAs at various times post-inoculation (0, 12, 24, 48, and 72 h) were compared with that of Ago1A at 0 h post-inoculation. The numbers indicated the time points post-inoculation with WSSV. Each column represented the mean of triplicate assays within 1% standard deviation. The statistically significant differences between treatments were represented with an asterisk (*P<0.05).

