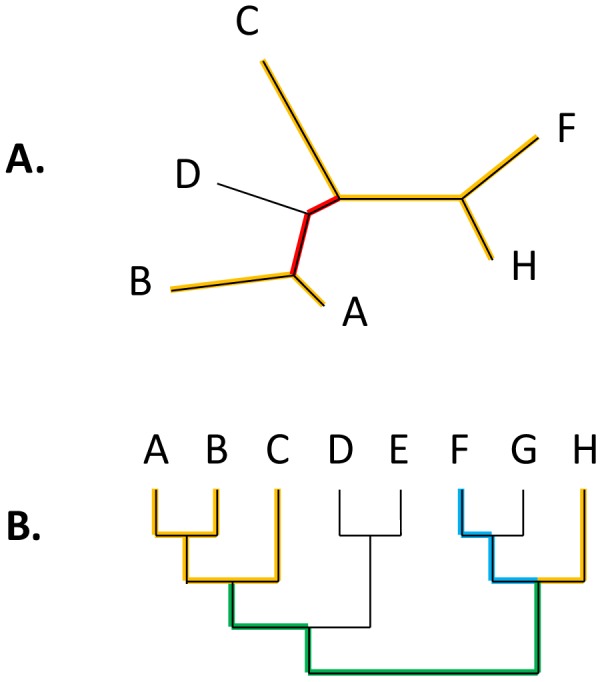
Figure 1. Gene trees and the supertree.

A. A gene tree (GT). After the comparison with the supertree (ST), the GT is reduced to the maximum agreement subtree (MAST, highlighted in yellow). The reduced GT edge highlighted in red corresponds to two edges in the original GT. B. Supertree (ST). Mapping of the reduced GT onto the ST is highlighted; two sections of ST that consist of multiple edges mapping to a single edge of the reduced GT are highlighted in blue and green, respectively.
