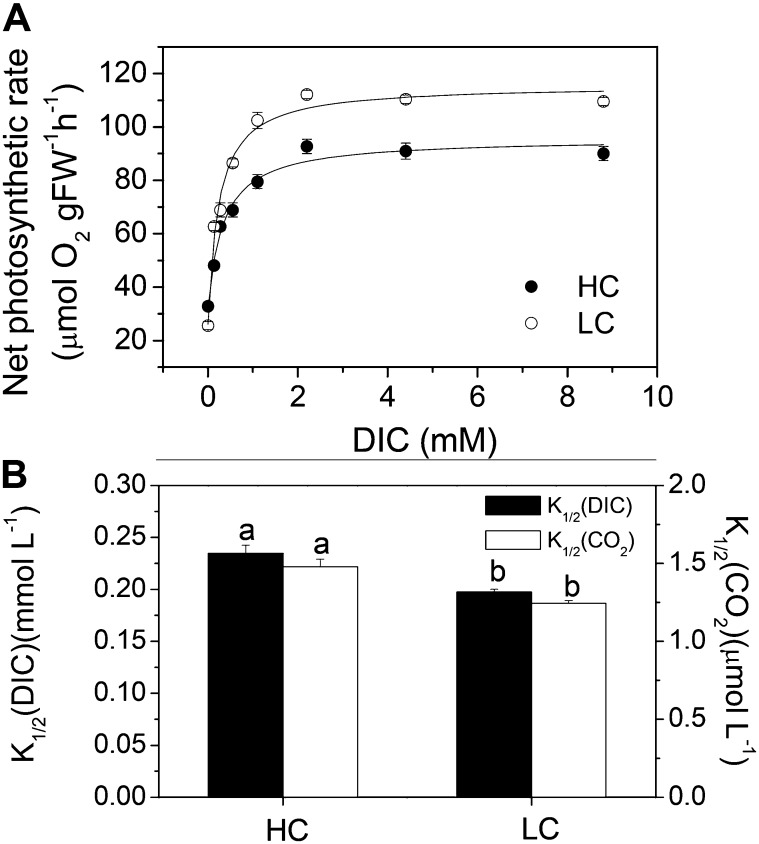
Figure 7.
A, Changes in net photosynthetic rate for U. prolifera plants grown for 2 months at ambient (LC; 390 µatm) and elevated (HC; 1,000 µatm) CO2 levels, measured at 600 μmol photons m−2 s−1 and 20°C, as a function of DIC concentration. B, DIC and CO2 concentrations for the K1/2, derived from A. Different letters above the bars represent significant (P < 0.05) differences between the CO2 levels. FW, Fresh weight.

