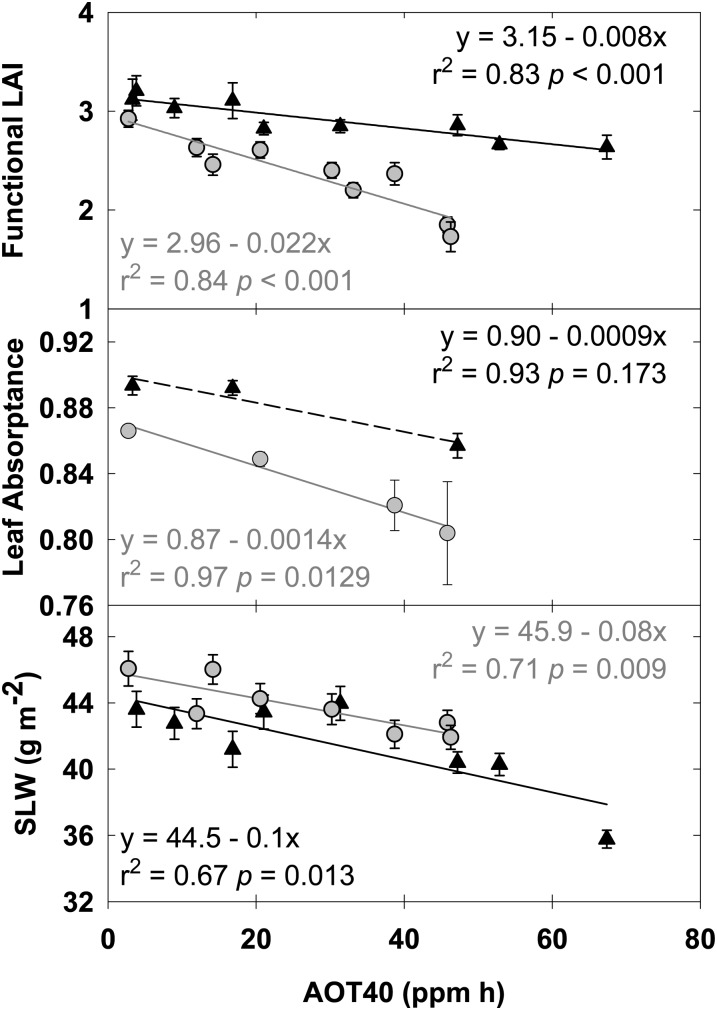
Figure 1.
Linear regressions of functional LAI (top panel), leaf absorption (middle panel), and specific leaf mass (SLW; bottom panel), which were measured throughout the growing season in 2009 (black triangles) and 2010 (gray circles). Solid lines indicate statistically significant relationships (P < 0.05), while dashed lines indicate nonsignificant trends. Error bars represent 95% confidence intervals.

