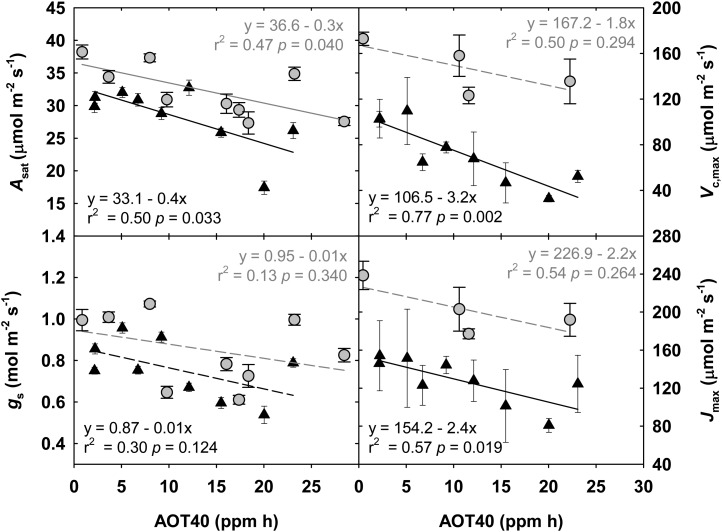
Figure 2.
Linear regressions of midday measurements of A, gs, Vc,max, and Jmax, which were made during reproductive growth in 2009 (black triangles) and 2010 (gray circles). Cumulative AOT40 was summed from the beginning of the growing season up to the date of measurement in each year. Solid lines indicate statistically significant relationships, while dashed lines indicate trends. Error bars represent 95% confidence intervals.

