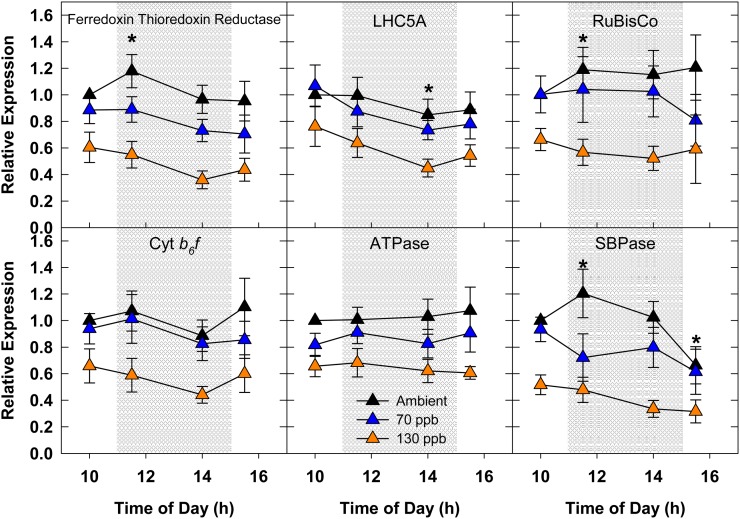
Figure 4.
Season average diurnal expression of select photosynthetic transcripts in 2009. Relative fold change values were calculated by comparing absolute values with the 10 am ambient measurement. The shaded region signifies the period when O3 was being fumigated. Error bars represent 95% confidence intervals. Asterisks indicate significant diurnal effects in transcript abundance for ambient-grown plants compared with the ambient 10 am sampling time.

