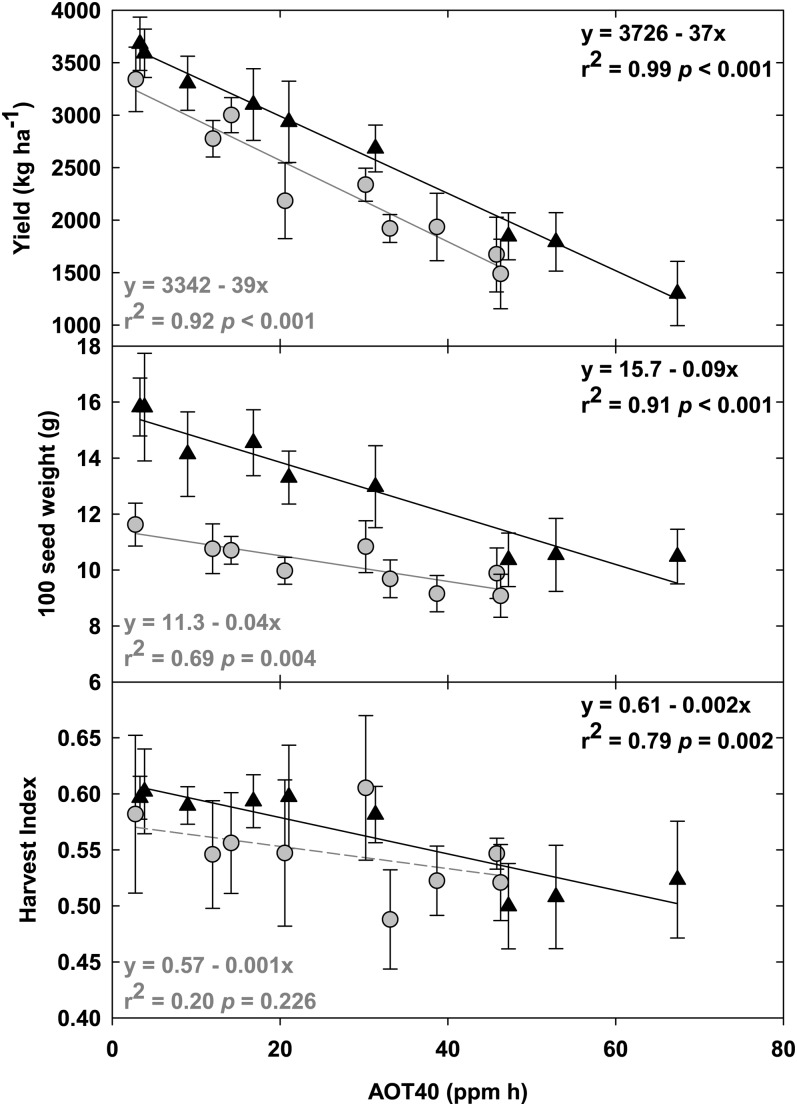
Figure 6.
Linear regression of agronomic yield (top panel), 100 seed weight (middle panel), and harvest index (bottom panel) at the end of the growing season in 2009 (black triangles) and 2010 (gray circles). Solid lines indicate statistically significant relationships, while broken lines indicate trends. Error bars represent 95% confidence intervals.

