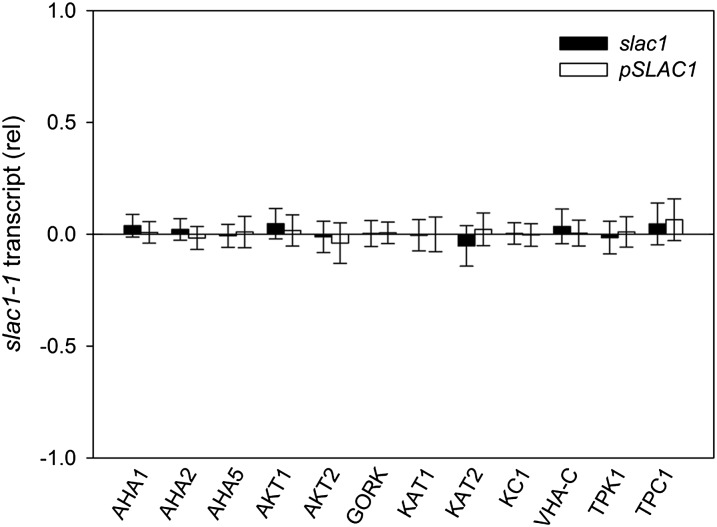
Figure 3.
Relative transcript levels for selected plasma membrane and tonoplast transporters from slac1-1 and pSLAC1 Arabidopsis assayed by quantitative PCR. Data are means ± se of three independent experiments and are reported as the change in expression relative to wild-type levels (=0) after normalizing to the housekeeping ACT2 actin gene and TUB9 tubulin gene transcripts.

