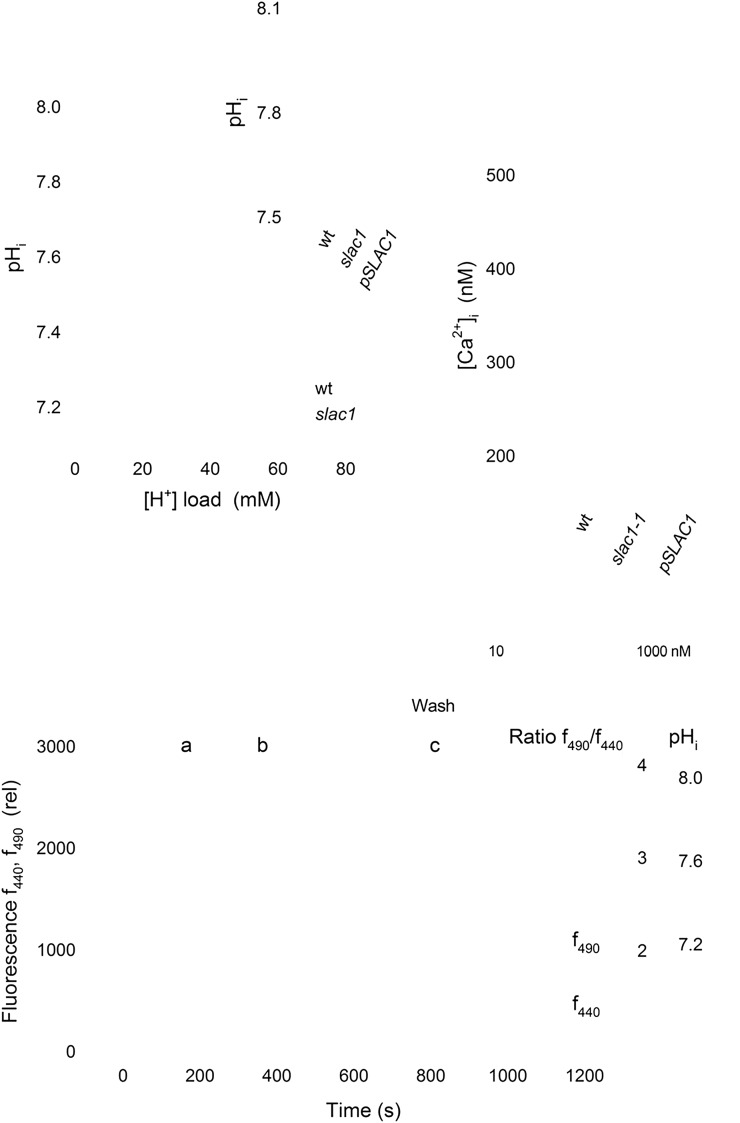
Figure 5.
The slac1-1 mutant shows elevated pHi and [Ca2+]i. A, Mean ± se for pHi (inset; n ≥ 7) and pH buffering analysis (n = 3) from guard cells of wild-type (wt; open circles) and slac1-1 mutant (closed circles) Arabidopsis using BCECF fluorescence ratio analysis and before and during acid loading with 1 and 3 mm butyrate. Buffering determined by linear fitting (solid lines; Grabov and Blatt 1997) gave 84 ± 6 mm H+ per pH unit (wild type) and 143 ± 13 mm per pH unit (slac1-1). pHi values from slac1-1 guard cells differed significantly (**P < 0.001) from those of wild-type and pSLAC1 plants. B, pHi recording from one slac1-1 mutant guard cell using BCECF fluorescence ratiometry. Fluorescence at 440 nm (f440; open circles), 490 nm (f490; open triangles), and the fluorescence ratio (f490/f440 and calibrated pHi; closed circles) were recorded at 10-s intervals from 1.5 μm depth around the cell periphery. Representative images (top) were taken at the time points indicated. The intensity-modulated pseudocolor scale (left to right) represents pH 8 to 6. The period of BCECF injection, exposure to 3 mm butyrate (But), and butyrate washout are as indicated. C, Mean ± se (n ≥ 5) for resting [Ca2+]i. Values for slac1-1 guard cells differed significantly (**P < 0.001) from those of the wild type and pSLAC1.

