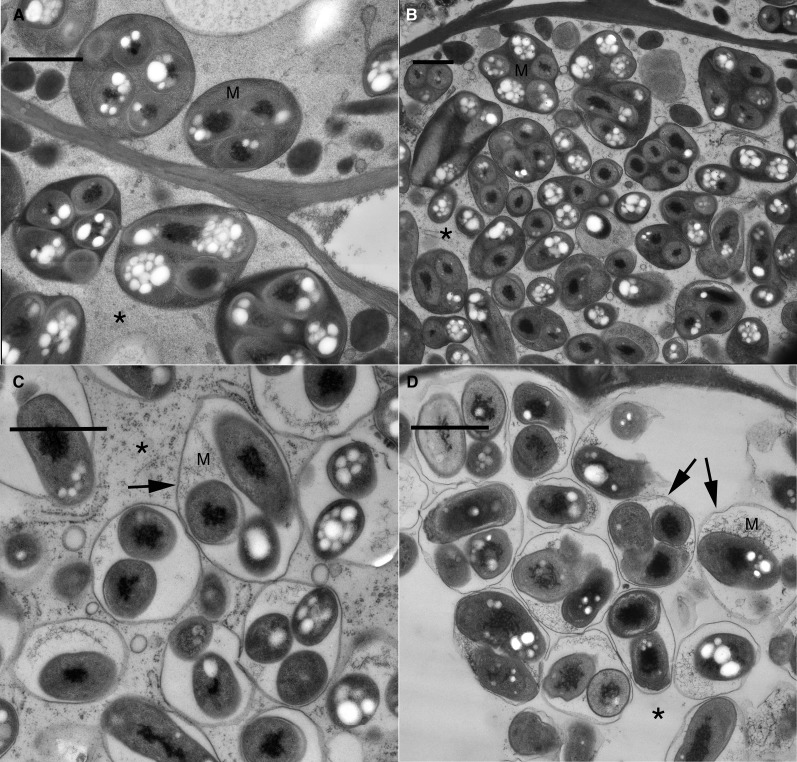
Figure 6.
TEM micrographs showing the cytoplasm and symbiosome matrix from mature (A and B), medium-sized (C), and small empty (D) nodules. A, Empty vector. Typical symbiosomes with matrix (M) and host cytoplasm intact (asterisk) are seen. B, GUS control (as in A). C, 14-3-3 medium-sized nodule. Cytoplasm is intact (asterisk), but matrix (M) is degraded. D, 14-3-3 small empty nodule. Cytoplasm (asterisk) and matrix (M) are degraded; the symbiosome membrane remains (arrows). These micrographs are derived from one representative experiment of three independent biological replications. Bars = 1 μm.

