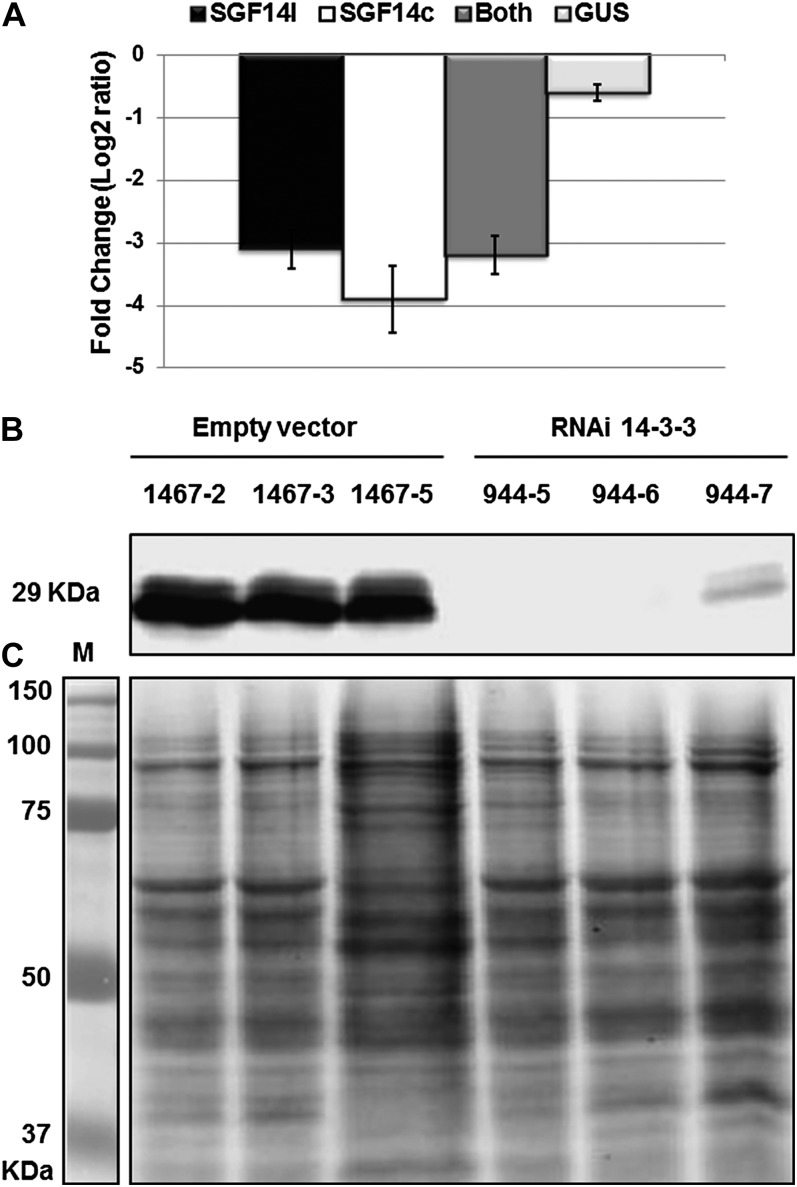
Figure 9.
mRNA and protein reduction in soybean silenced tissues after inoculation with B. japonicum. A, qRT-PCR results showing the relative transcript accumulation of different genes after normalization using the geometric mean of cons4 and Actin reference genes. Bars are as follows: light gray bar, RNAi GUS; dark gray bar, SGF14c (Glyma05g29080); black bar, SGF14l (Glyma08g12220); white bar, both genes. In each histogram, the means of three biological replicates are represented ± se (n = 3). B, Western blot using soybean-specific antibody (anti-SGF14cl) against soybean protein extracted from nodules collected at 16 dpi from three independent RNAi 14-3-3 lines (944-5, 944-6, and 944-7) and three independent empty vector lines (1467-2, 1467-3, and 1467-5). C, Partnered Coomassie blue-stained gels are shown as evidence of equal loading.

