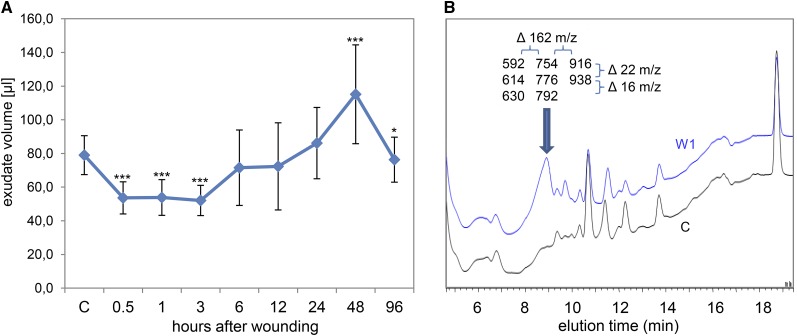
Figure 3.
The volume of pumpkin phloem exudates changes concurrent with an accumulation of polysaccharides upon leaf wounding. A, The exudate volume decreased transiently at 0.5, 1, and 3 h after wounding of all leaves. Error bars indicate the sd of 13 replicates. Asterisks indicate statistically significant differences from control samples from untreated plants (Student’s t test, *P < 0.05; ***P < 0.001). B, The decrease in volume correlated with an accumulation of polysaccharides in the exudates at 1 h after wounding (W1; top curve), probably representing callose formation. The HPLC fractions containing the peak marked by the arrow were analyzed by FIE-MS. Resulting masses (mass-to-charge ratio [m/z]) are shown. Note the mass differences of 162 (one sugar unit) between columns and 22 (protonated versus sodium adduct) or 16 (sodium versus potassium adduct) between rows of displayed masses. C, Control. [See online article for color version of this figure.]

