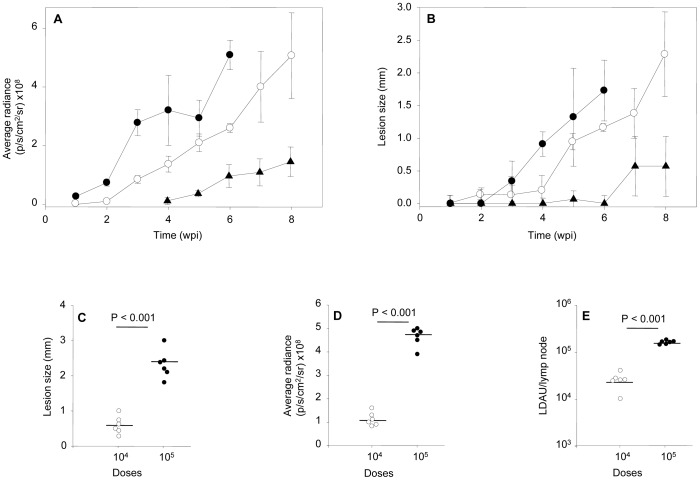
Figure 6. Follow up of the in vivo Leishmania major infection.
A) Plot comparing the progression of fluorescence signal (pixel/second/cm2/sr) mean ± SEM over the time. (B) Plot comparing the progression of lesion size (mm) mean ± SEM over the time. Key: infective inocula: 106 (•), 105 (○), 104 (▴) metacyclic promastigotes per mouse. Effect of infective inocula on: C) lesion size (mm), D) fluorescence signal (pixel/second/cm2/sr), E) parasitic load (LDAU) in the poplyteal lymph node draining the lesion of infected animals. Key: infective inocula: 104 (○), 105 (•). Data were individually collected at the end of the experiment.

