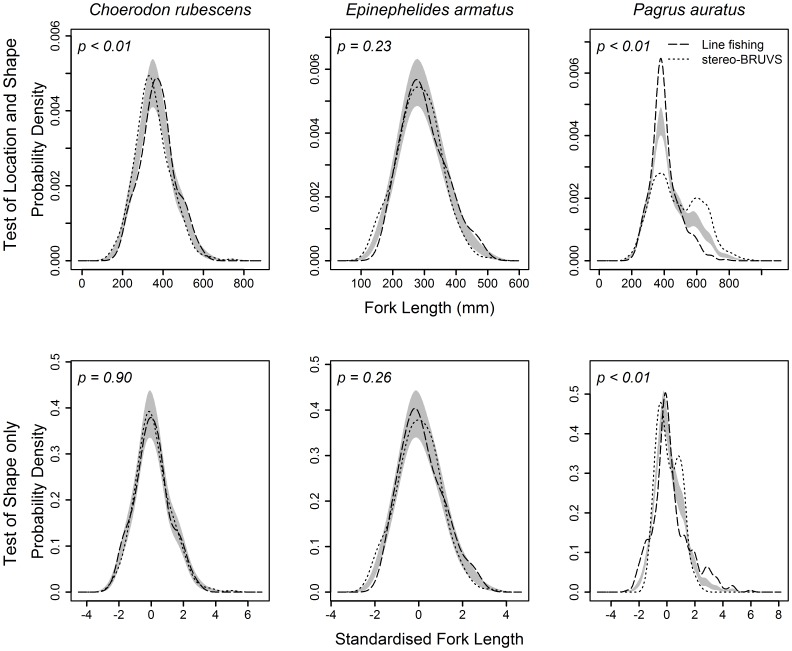
Figure 3. Comparison of kernel density estimate (KDE) probability density functions, using mean bandwidths, for Choerodon rubescens, Epinephelides armatus and Pagrus auratus sampled using either line fishing (Line) or stereo-BRUVS.
Dashed and dotted lines represent the kernel density estimate (KDE) probability density functions that approximate the Line and stereo-BRUVS length-frequency data, respectively. Grey bands represent one standard error either side of the null model of no difference between the KDEs for each method. Significance tests (p) were based on permutation tests of the area between the two probability density functions. Significance tests on raw data (top row) provide a test of differences in both location and shape of the length-frequency distributions, whereas tests on standardised data (bottom row) provide a test of shape only.

