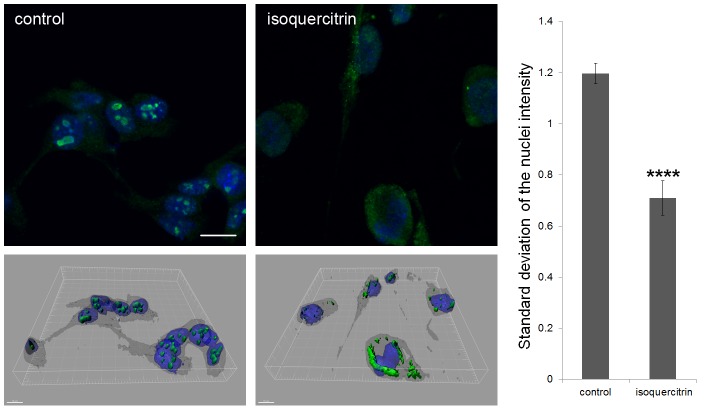
Figure 7. Isoquercitrin causes a change in RhoA localization.
Upper left, The fluorescent images (acquired with 63× oil objective) show immune-staining of RhoA in 48 hr cultures. Green = RhoA, blue = nuclei. Scale bar = 20 micron. Bottom left, 3D projections of z-stack images – obtained with Imaris software - corresponding to 2D images above. Scale bar = 15 micron. Right, The bar graph illustrates the standard deviation of the fluorescence in the nuclei normalized by the cytoplasmic fluorescence for each cell. (n = 10 images, pair sample t-Test, ****p<0.0001). Data are shown as means ± s.e.m.

