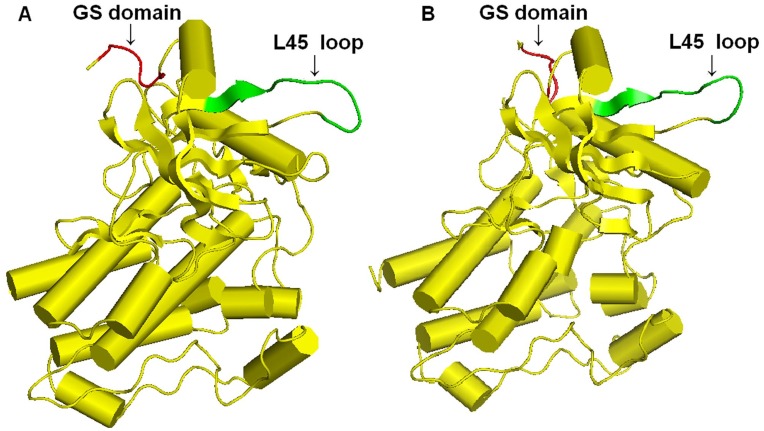
Figure 3. Molecular model of the three-dimensional structure of the kinase domain of scallop Tgfbr1 (A) and human Tgfbr1 (B).
Cylinders and flat arrows represent α helices and β sheets, respectively. Conserved structures were found in the kinase domains of scallop Tgfbr1 and human Tgfbr1; the GS domain and L45 loop are colored red and green, respectively.

