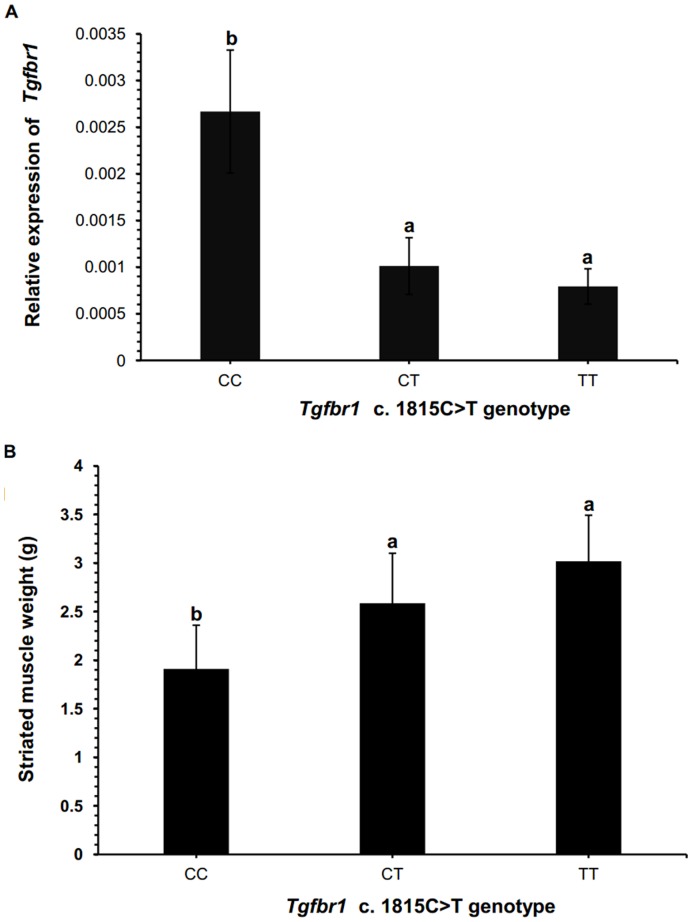
Figure 6. Tgfbr1 expression levels in striated muscle and the striated muscle weights in scallops with different genotypes.
For each genotype, six scallops were randomly selected. Associations of the SNP c. 1815C>T with the Tgfbr1 expression level in striated muscle (A), and the striated muscle weight (B) were tested in the 18 scallops. One way ANOVA was performed with post hoc test to compare the expression levels of Tgfbr1 among different genotypes, and the growth traits among the genotypes. Bars with different superscripts indicate significant differences (P<0.05). Pearson product-moment correlation analysis revealed inverse correlation between Tgfbr1 expression level in striated muscle and the striated muscle weight (r = −0.56, p = 0.03).

