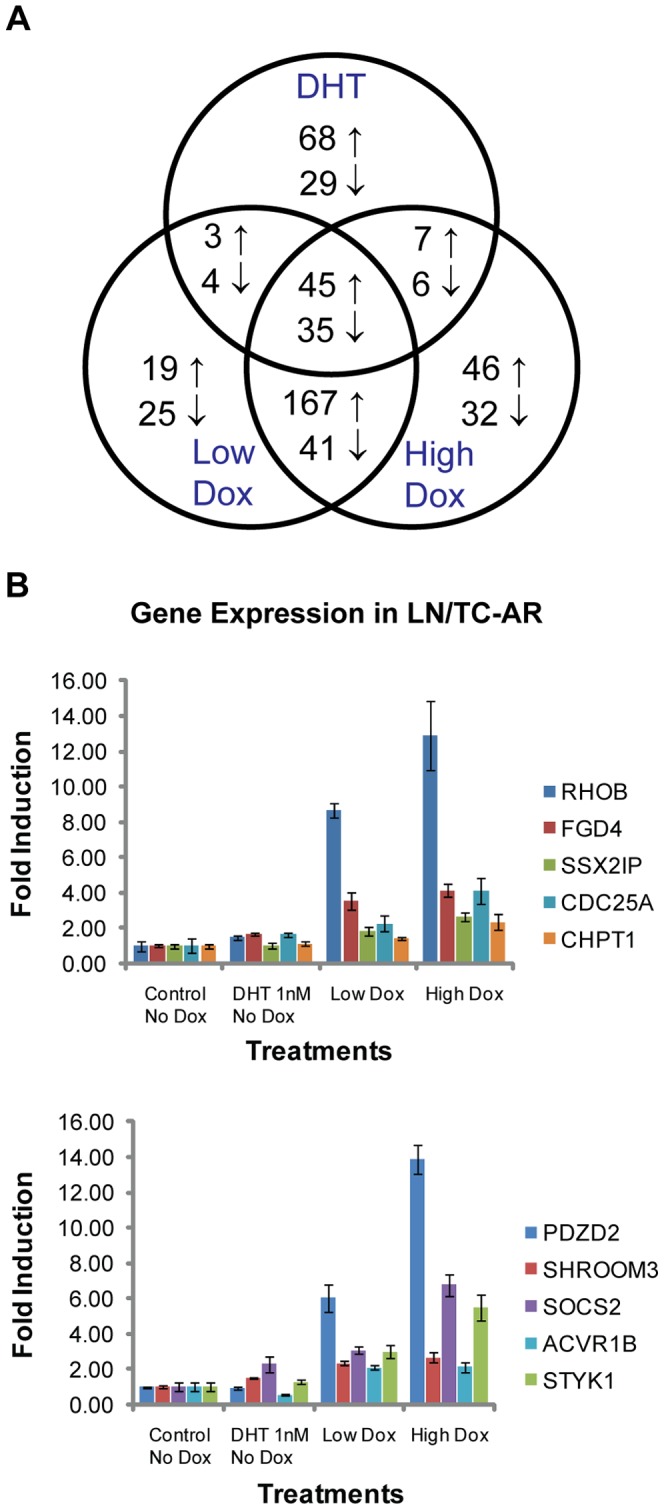
Figure 4. Comparison of gene expression in LN/TC-AR following induction of TC-AR or treatment with DHT.

A Venn diagram of microarray analyses of LN/TC-AR cells treated with 1 nM DHT or different concentrations of doxycycline for 24 hours post serum starvation. Numbers indicate genes that were commonly or uniquely upregulated (↑) or downregulated (↓) following the various treatments. B LN/TC-AR cells were treated with Low Dox, High Dox, 1 nM DHT, or vehicle in hormone depleted media for 24 hours. Quantitative RT-PCR was performed for the selected genes. Fold induction is relative to values obtained in untreated control using identical gene specific primers.
