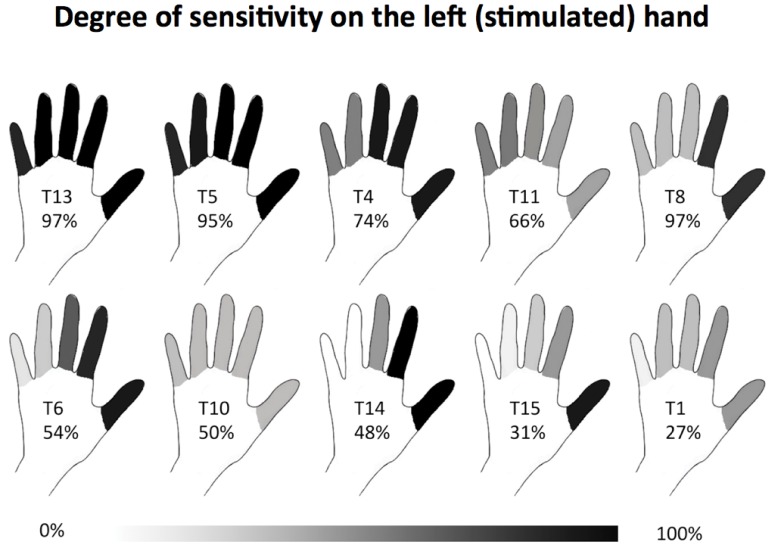
Figure 1. Subjective rating of tactile sensation on the stimulated hand in the S.
− group. Percentages indicate the strength of tactile sensation on each finger compared to the face and is represented as a gray scale from white (no sensation) to black (complete sensation, as on the face). The hands are sorted from the top left to the bottom right by the mean values, which are added to each hand numerically.

